Infrastructure
Management Page
The Management page is where admin users can accept or reject incoming nodes, access the Agent installation drawer, and create automation rules to automatically accept or reject nodes.
Accepting/Rejecting Nodes
When you install and get the Agent running for the first time, your node will initially be found in the Management page. You can accept or reject the node using the Accept or Reject buttons on that node's row.
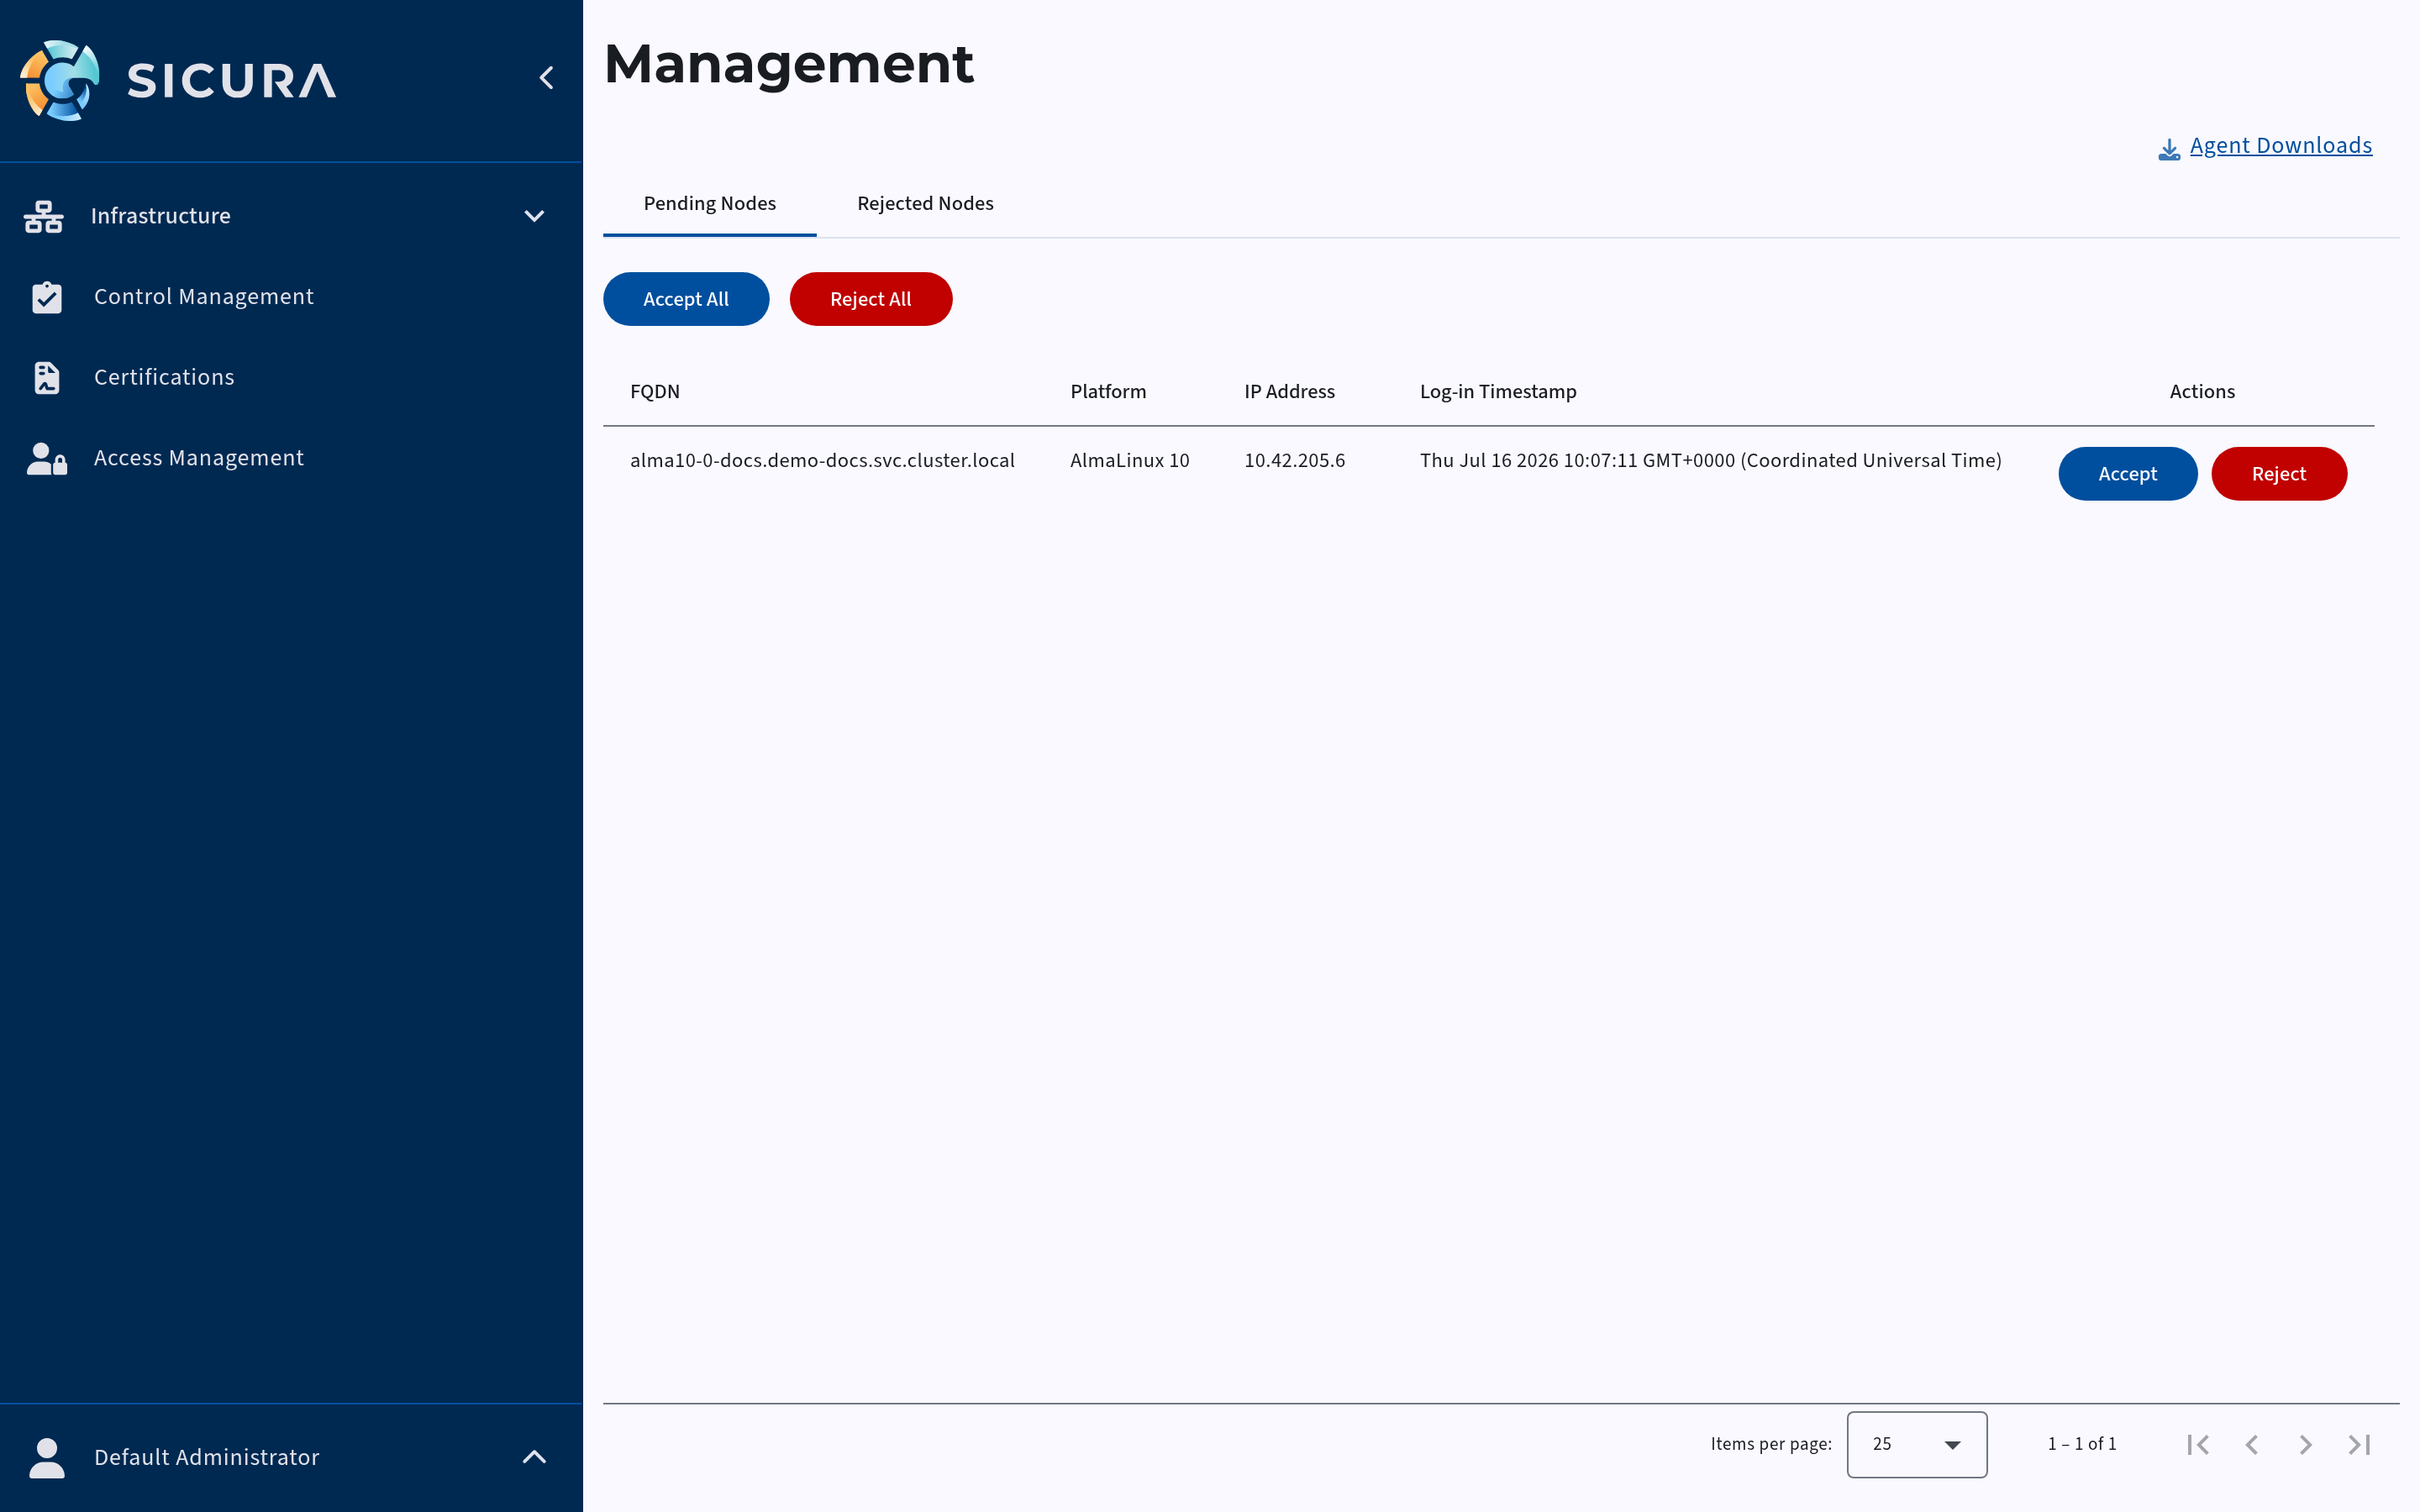
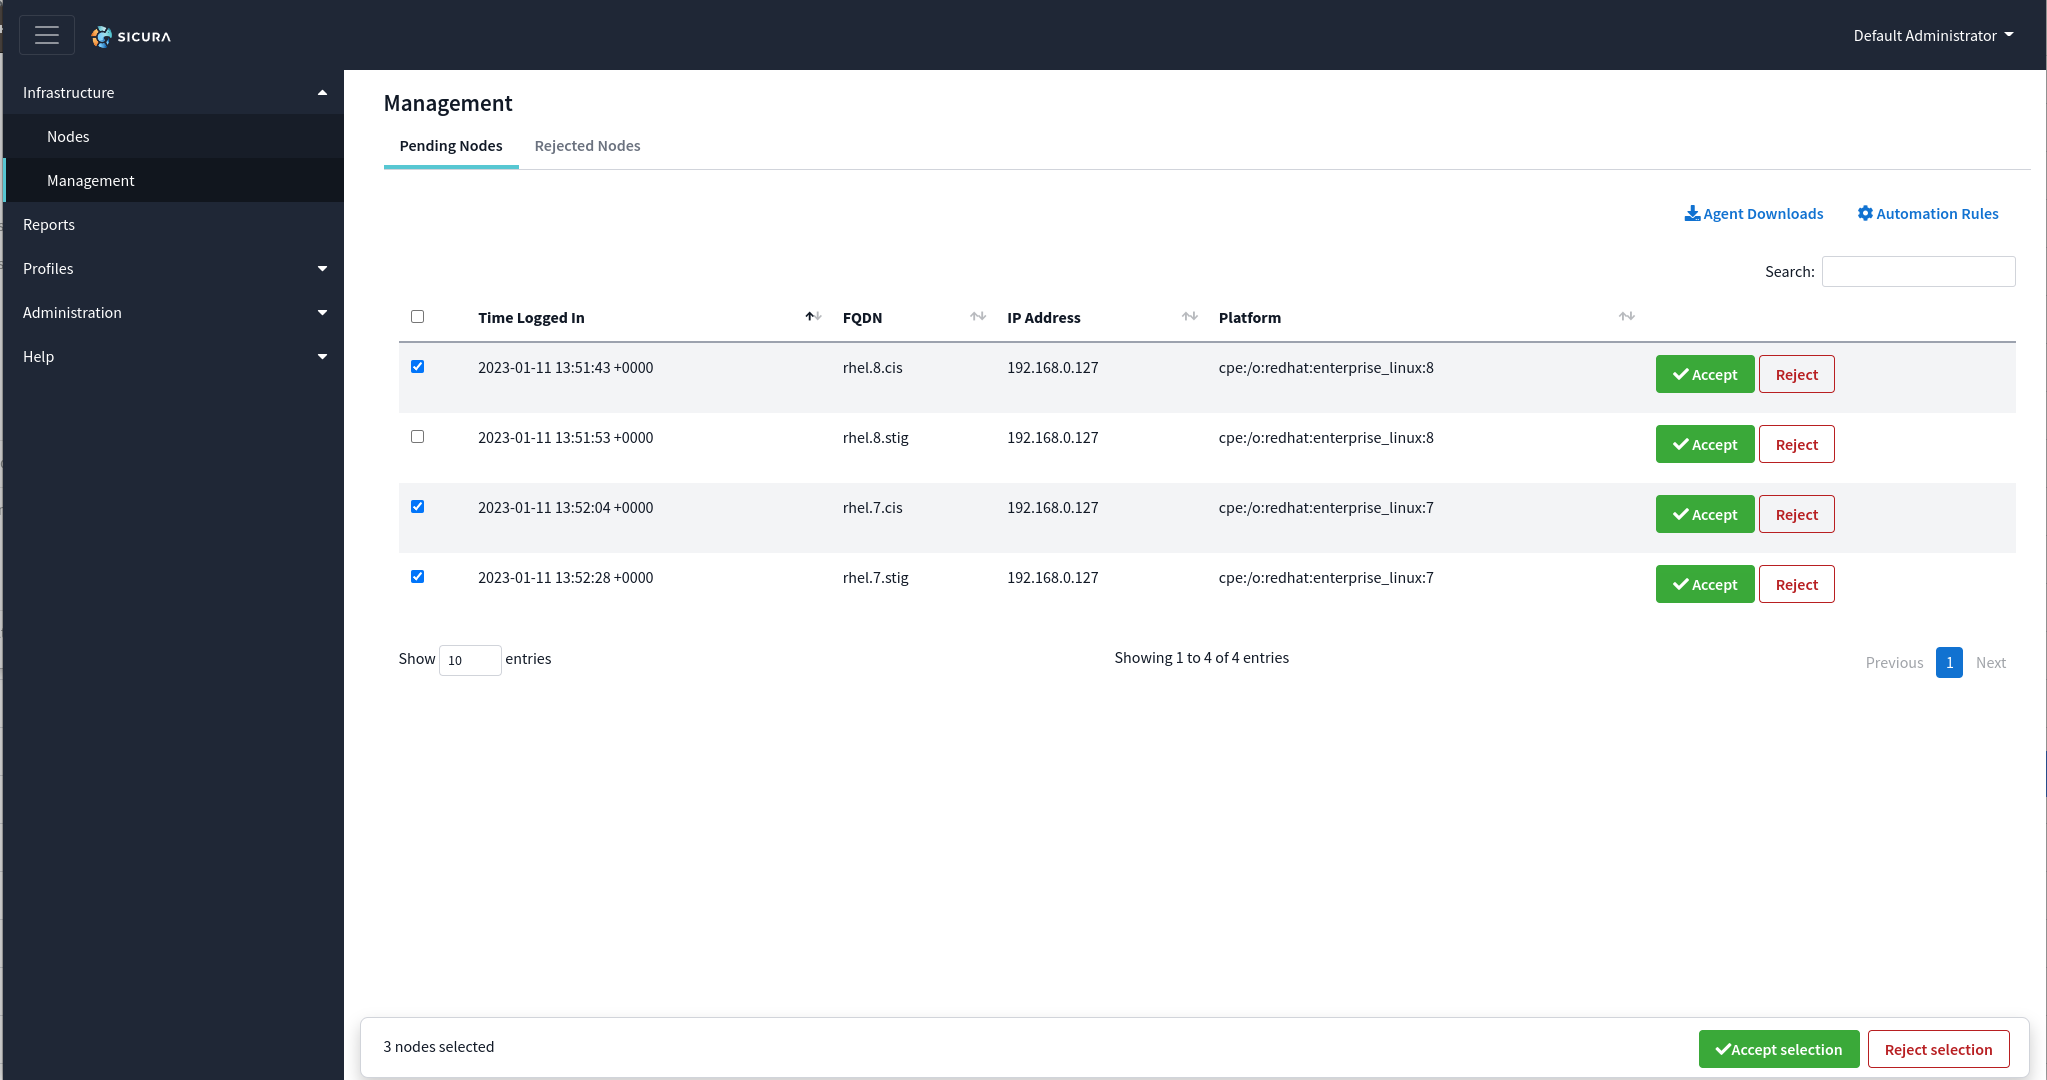
If the Management page has multiple nodes you would like to accept or reject, you can either use the checkbox at the top to select all of the nodes or select specific nodes you would like to accept or reject, then use the Accept or Reject buttons above the table.
Rejected Nodes
When the rejected button is clicked on one or more nodes, it will be sent to the rejected nodes table. This full list of rejected nodes can be found by clicking the Rejected Nodes tab.
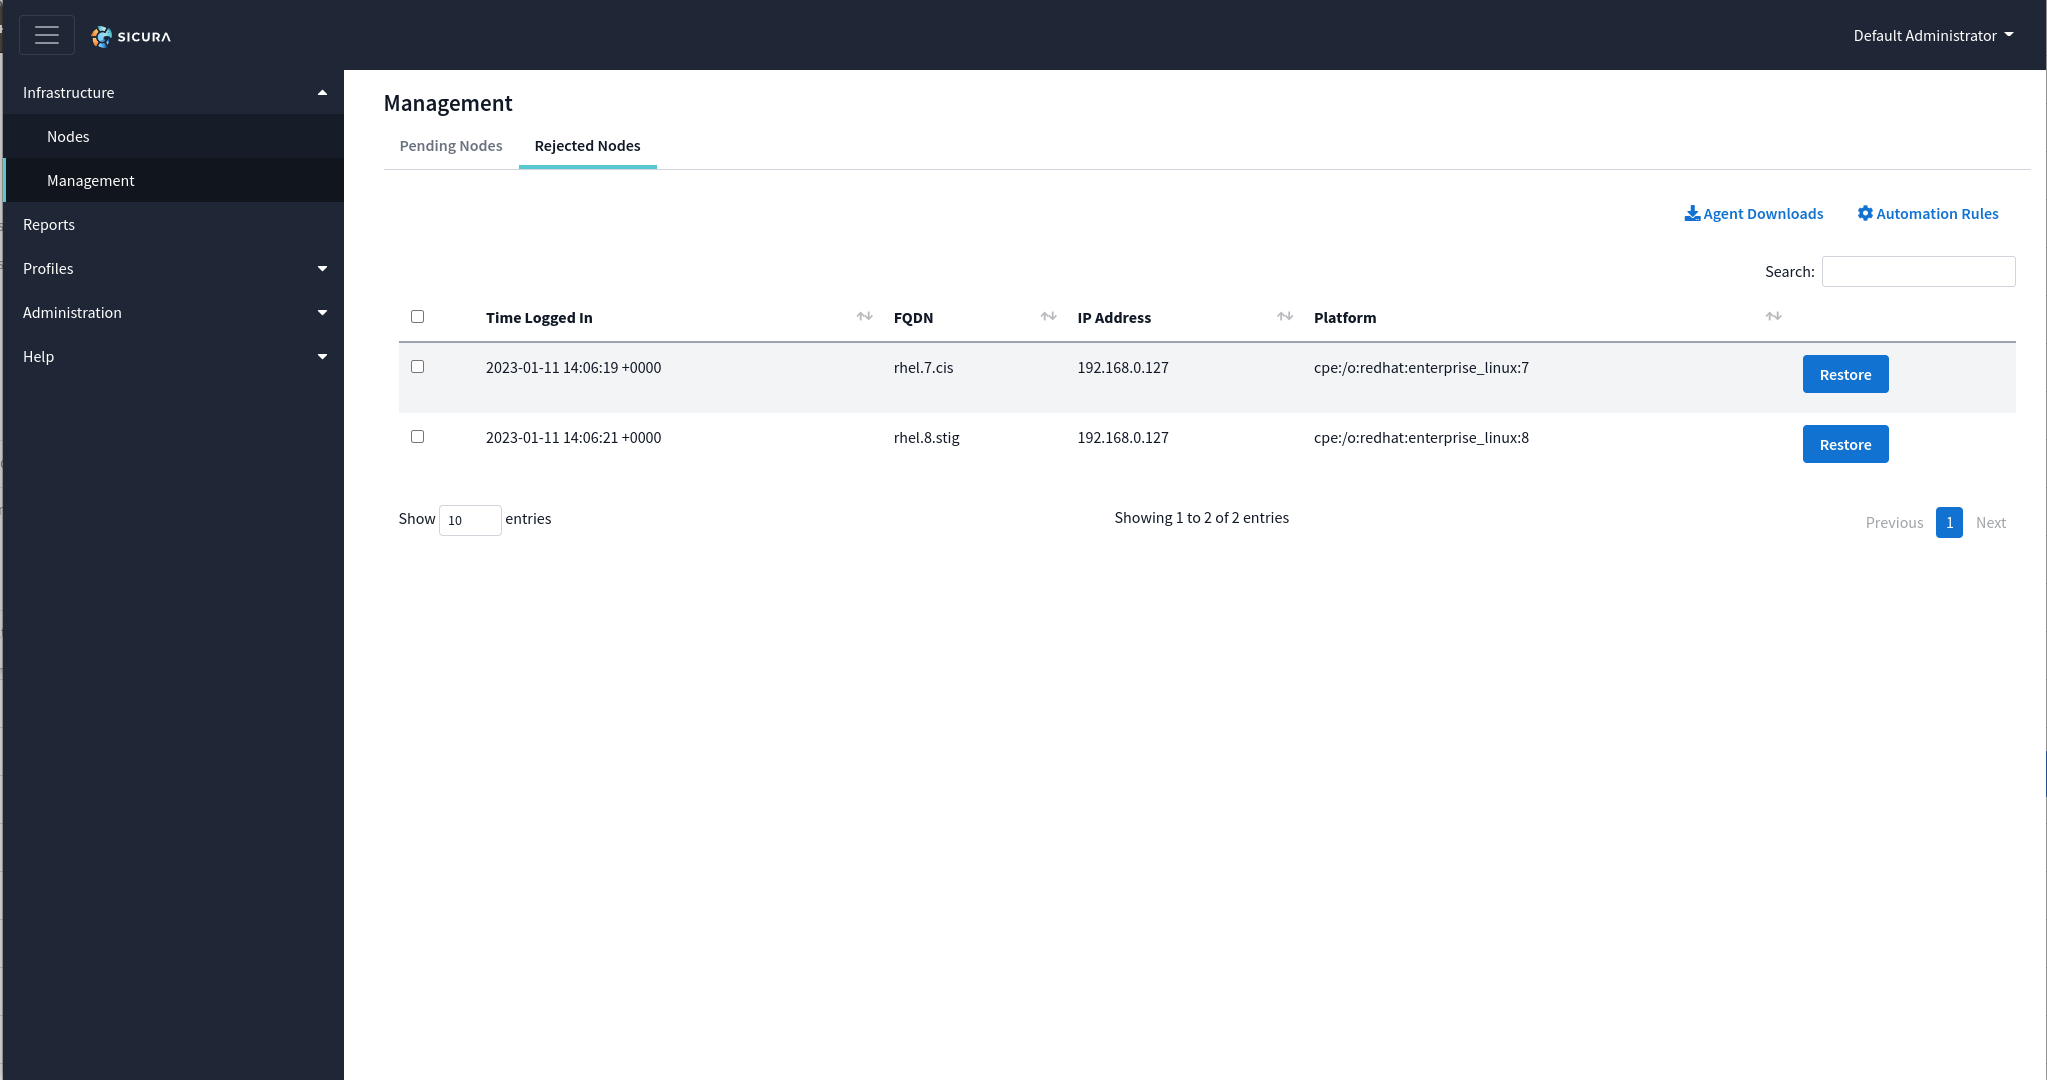
In the case you want to bring a node back into the Pending Nodes table, simply click restore. Once the Agent has reconnected, it will appear on the pending list and allow for acceptance into the infrastructure.
Agent Downloads
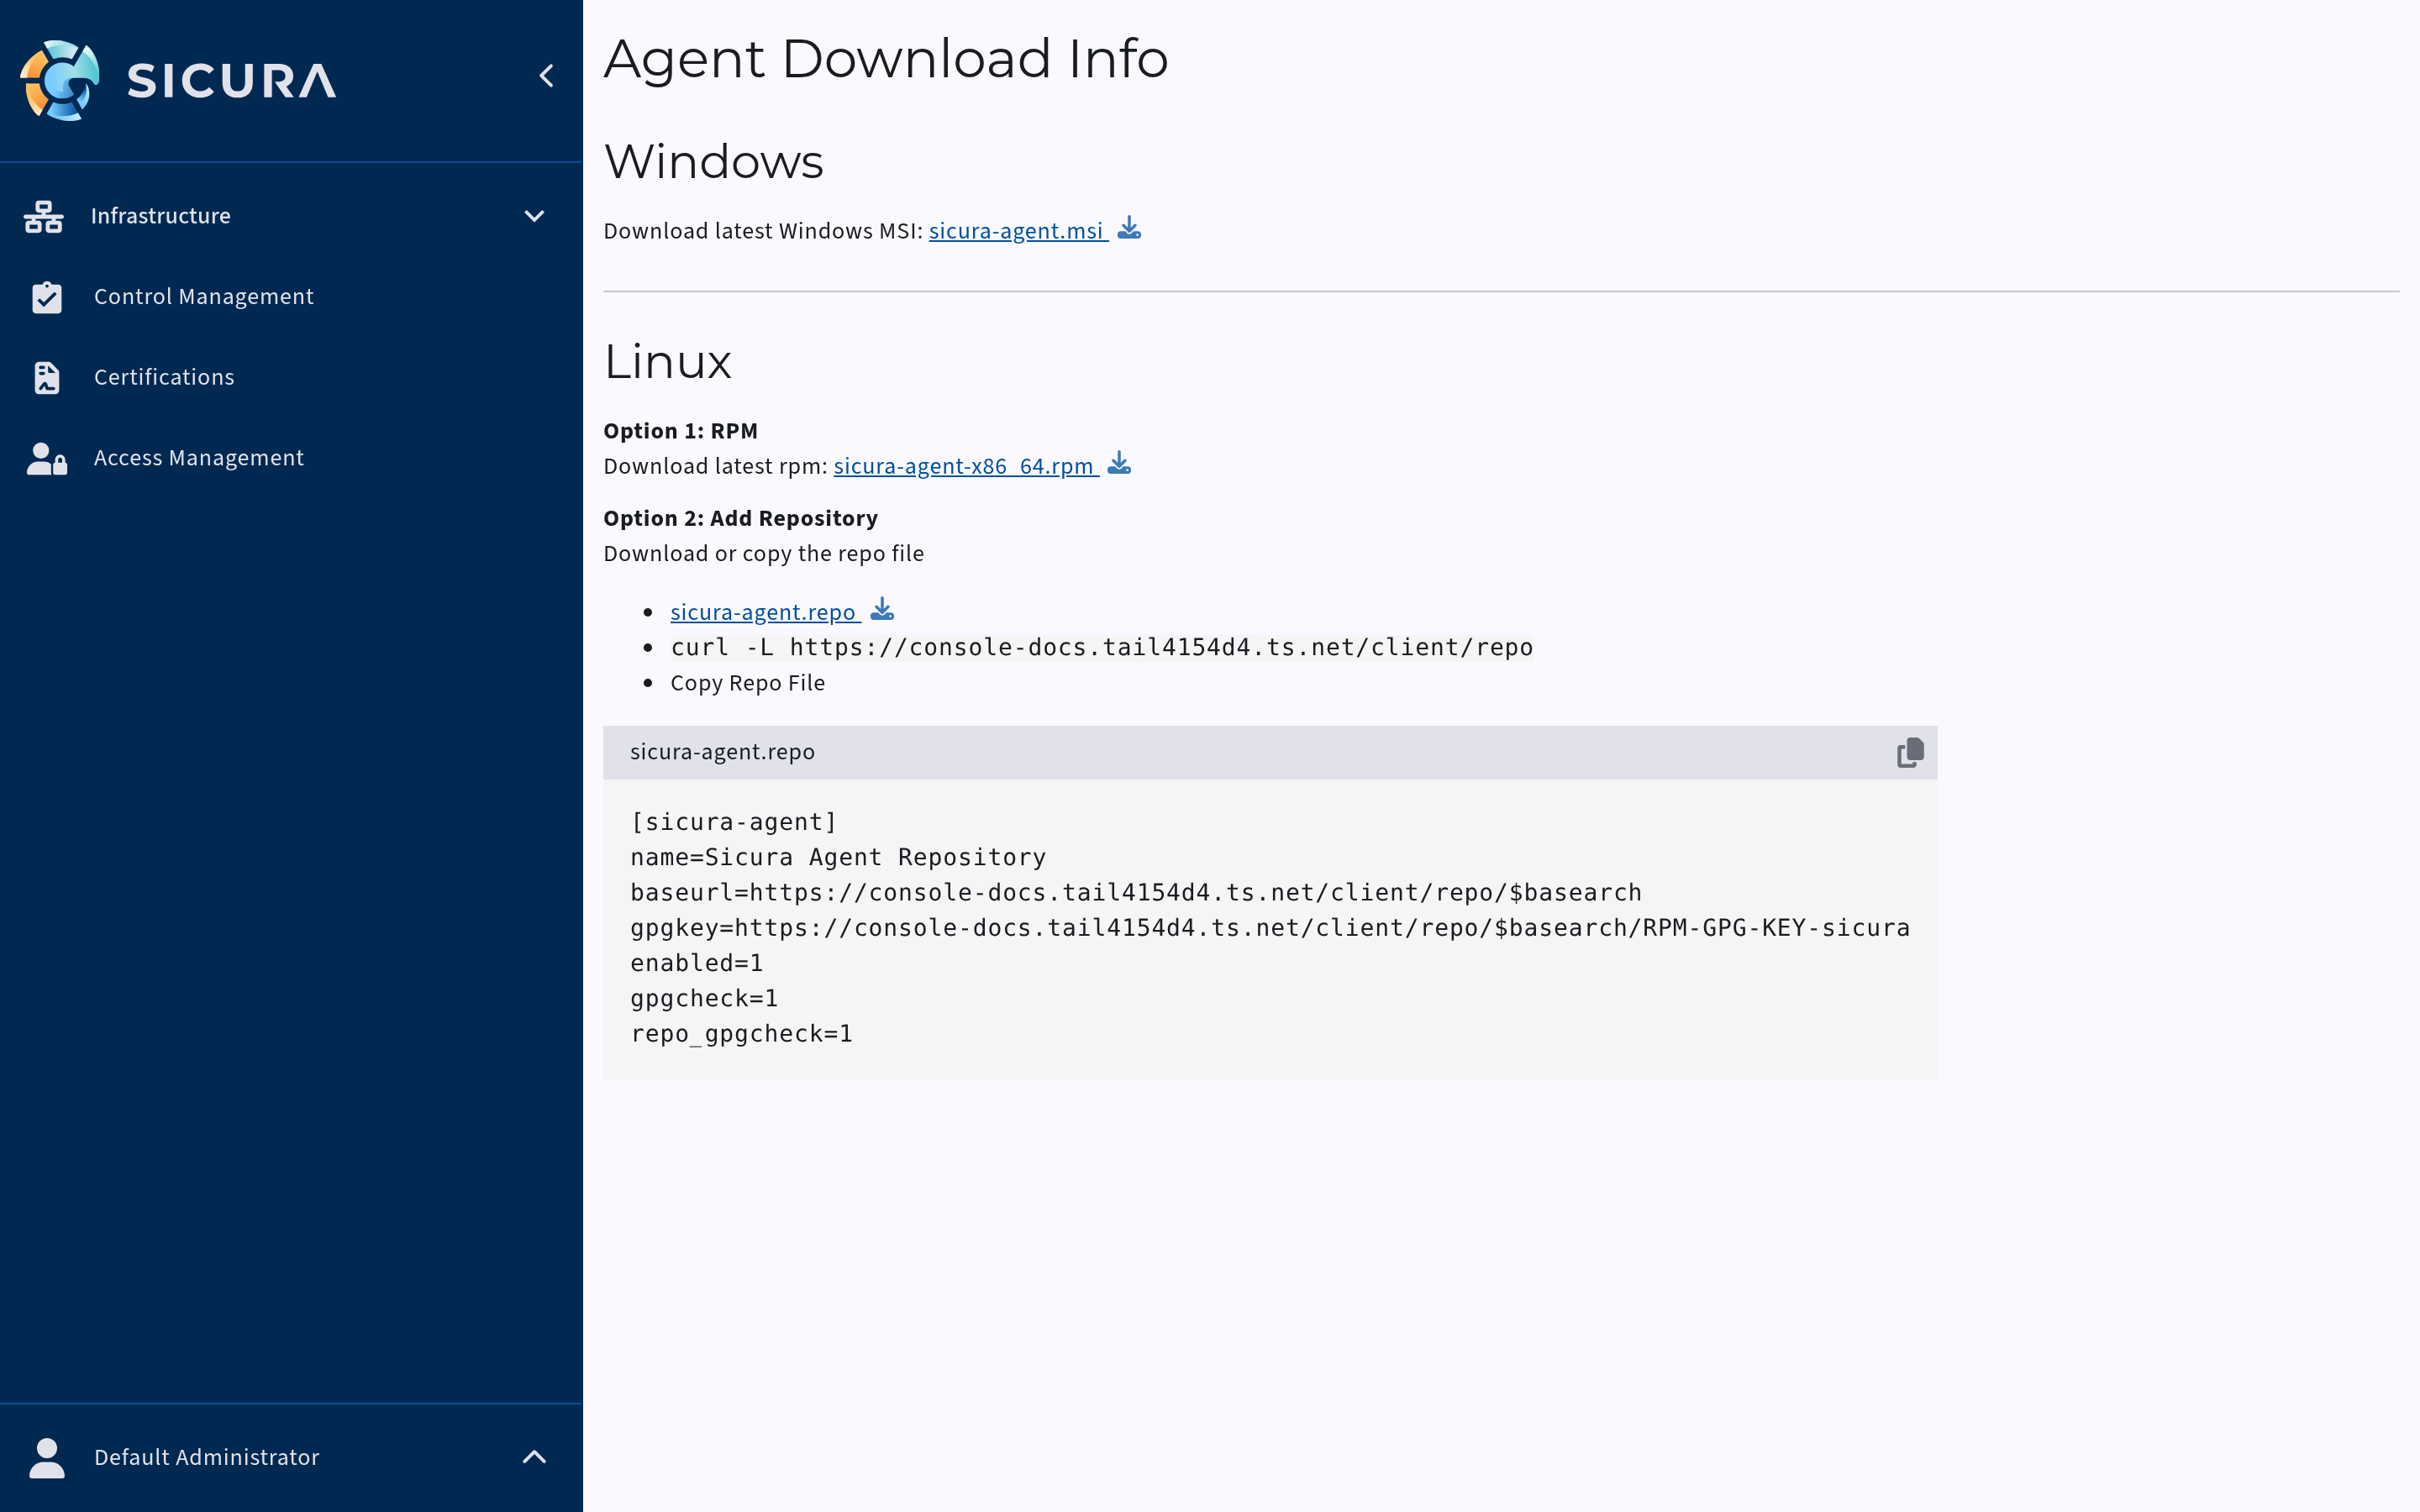
Inside the Agent Downloads drawer, you can find the Windows executable and Linux RPM for installation. The yum repository and instructions for installation can also be found in this drawer.
Automation Rules
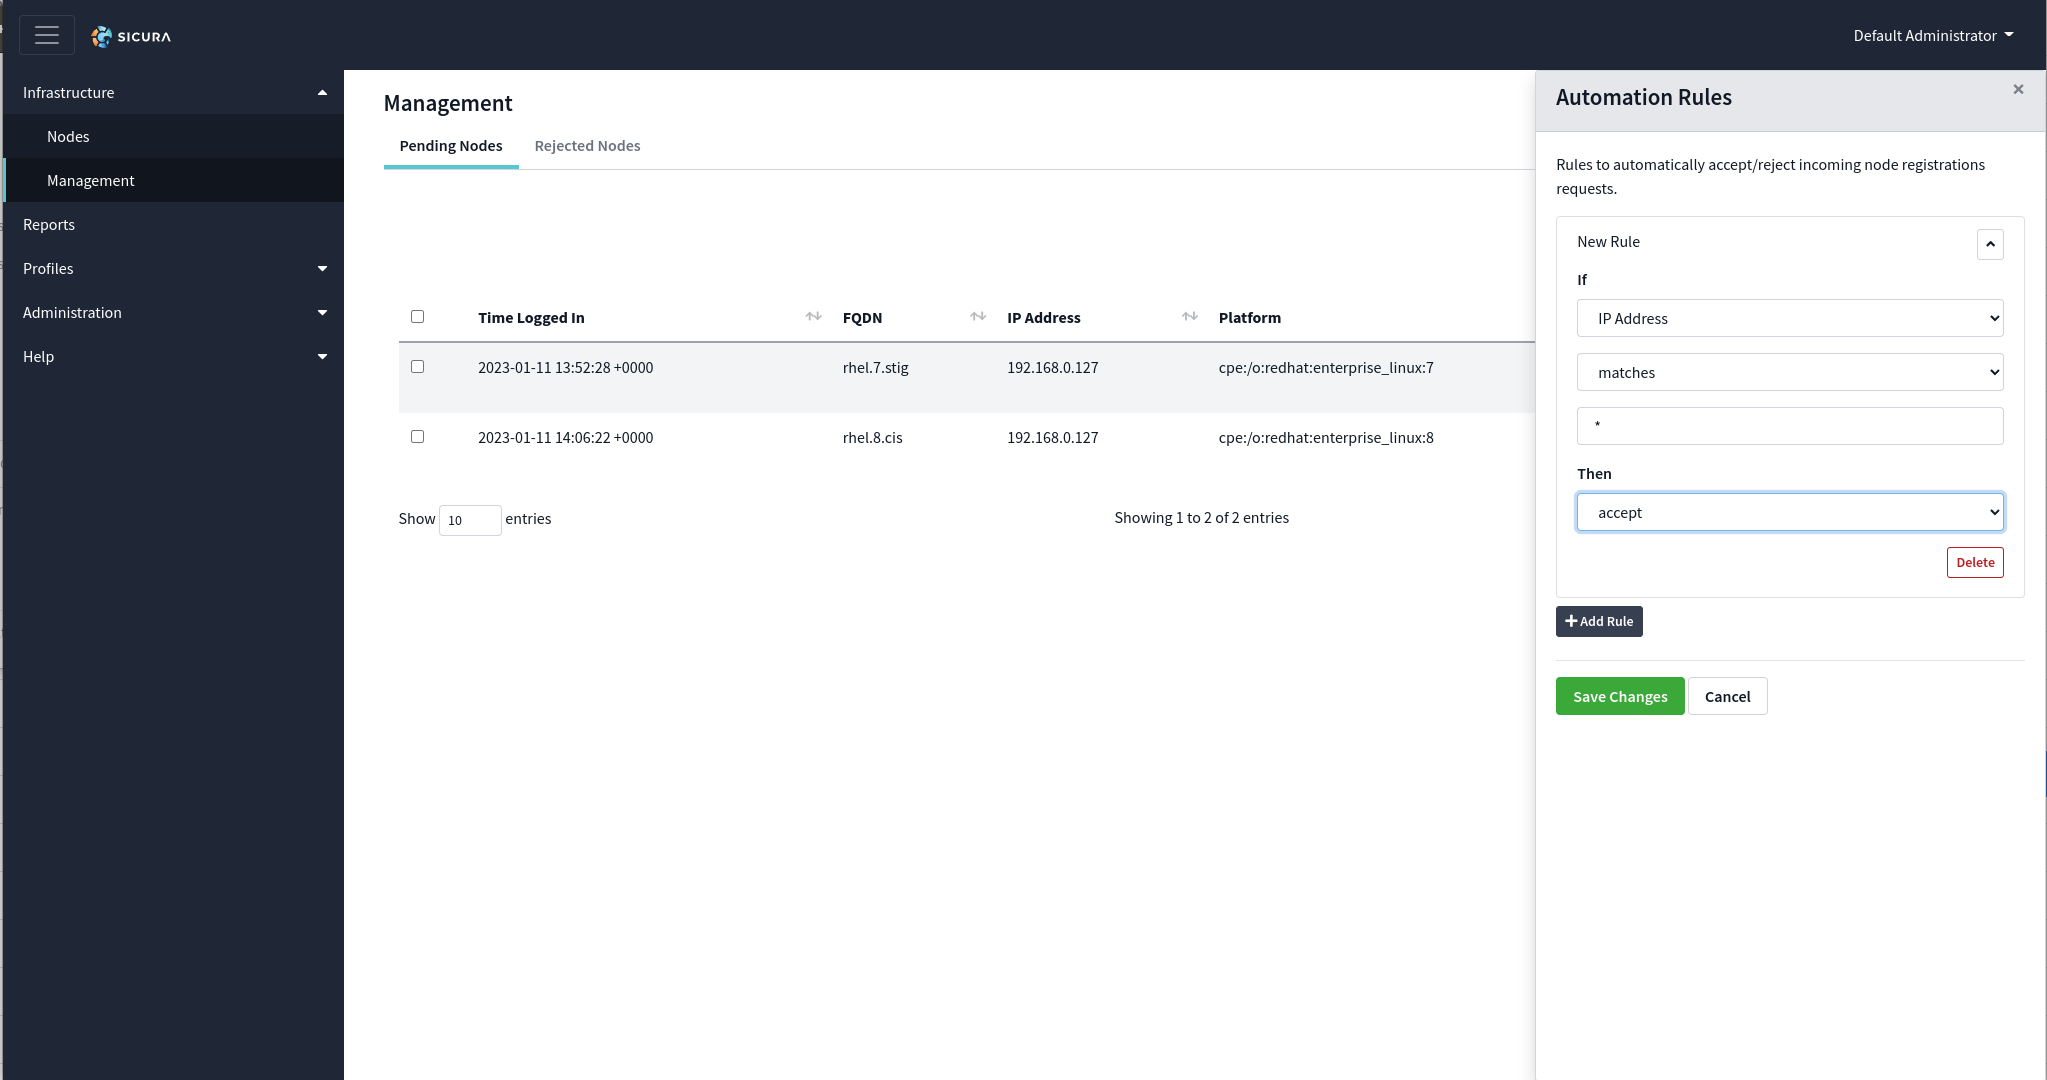
Inside the Automation Rules drawer, you can create different rules in which nodes can be automatically accepted or rejected depending on whether or not they match those custom rules.
-
When creating a custom automation rule for the 'If' section, you can start by selecting an object type (IP Address, Platform, FQDN) to compare with an incoming node.
-
Then, you can select the comparator type (matches or does not match) for the incoming node.
-
Finally, you can create a string to match based on the object type. Within the string box, you can use a wildcard ( * ) to allow any string to be used for that custom rule.
-
Once you have finished the 'If' section, you can select whether a node will be accepted or rejected in the 'Then' section's dropdown based on the 'If' section's custom rules.
Nodes Page
Nodes Tree
The nodes tree allows you to organize your infrastructure any way you like. Each system that has been registered to the Console appears here as a node.
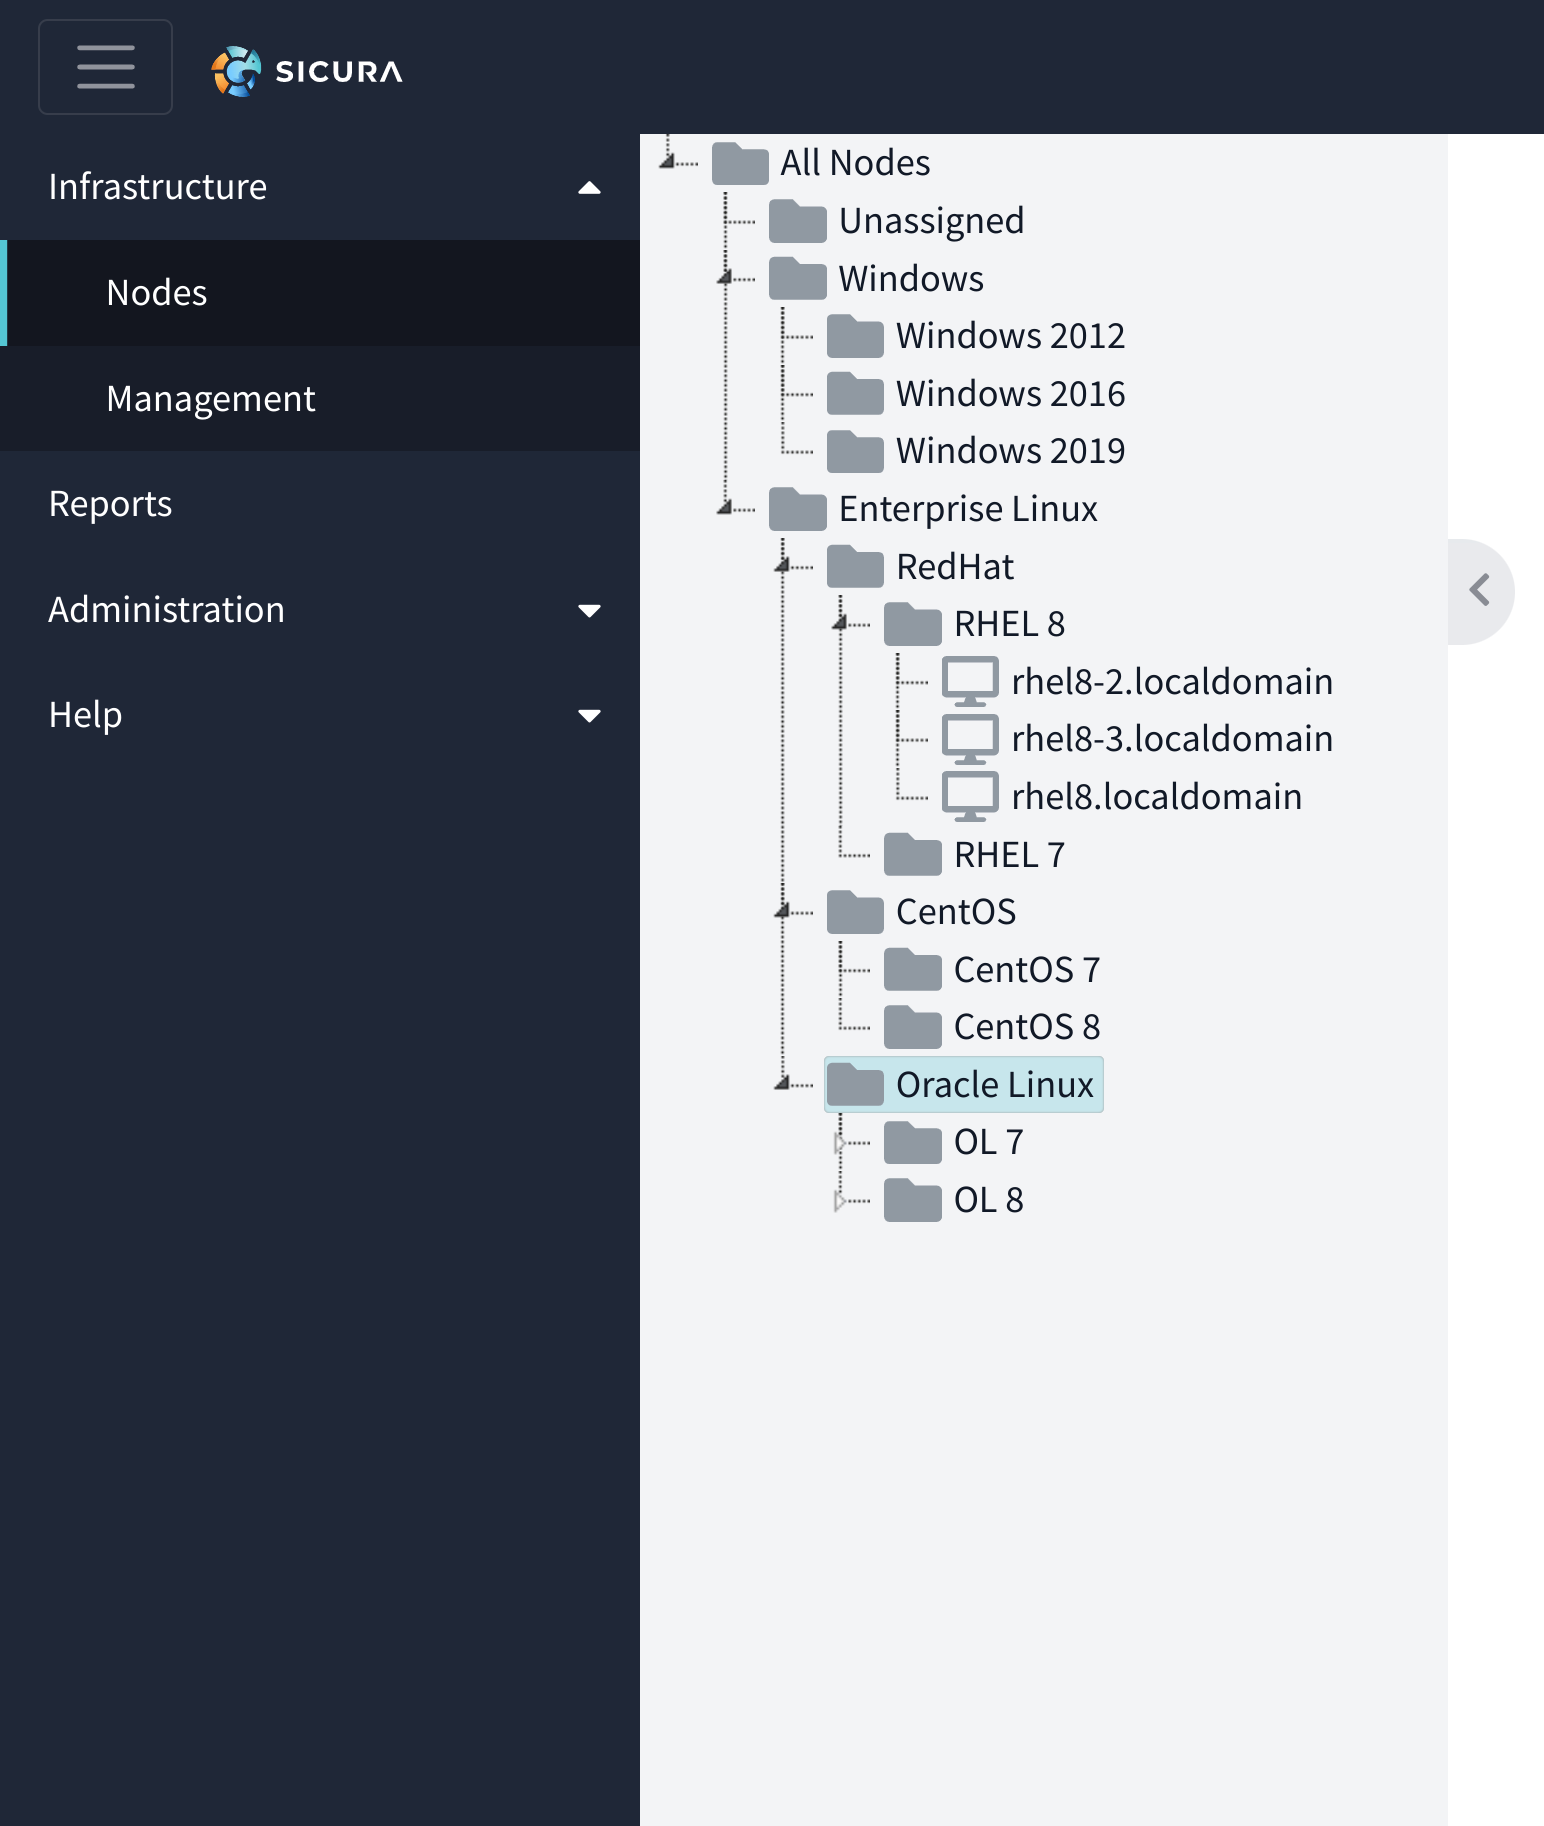
The tree can be collapsed by clicking the arrow tab or resized by clicking the resize bar on the right side.
There are two types of nodes that can exist inside the node tree: endpoint and folder.
Endpoint

-
Represents a physical (or virtual) machine.
-
An endpoint is created during registration with the Sicura Agent. Its name defaults to the hostname of the machine. A unique name can be set during the registration process or by right-clicking on the node and selecting Rename.
-
Other nodes cannot be stored inside of an endpoint.
-
Right-click and selecting Delete will remove the endpoint from the database but will not remove any of the scans/reports associated with it. This is by design and is used for auditing purposes.
Folder

-
Is used to organize other nodes and folders.
-
Folders are created by right-clicking on a folder and selecting New Folder
-
By default two folders exist,
All NodesandUnassigned. All new nodes will be found inUnassigned. -
Folders can only be deleted when they are empty.
Nodes (folders only)
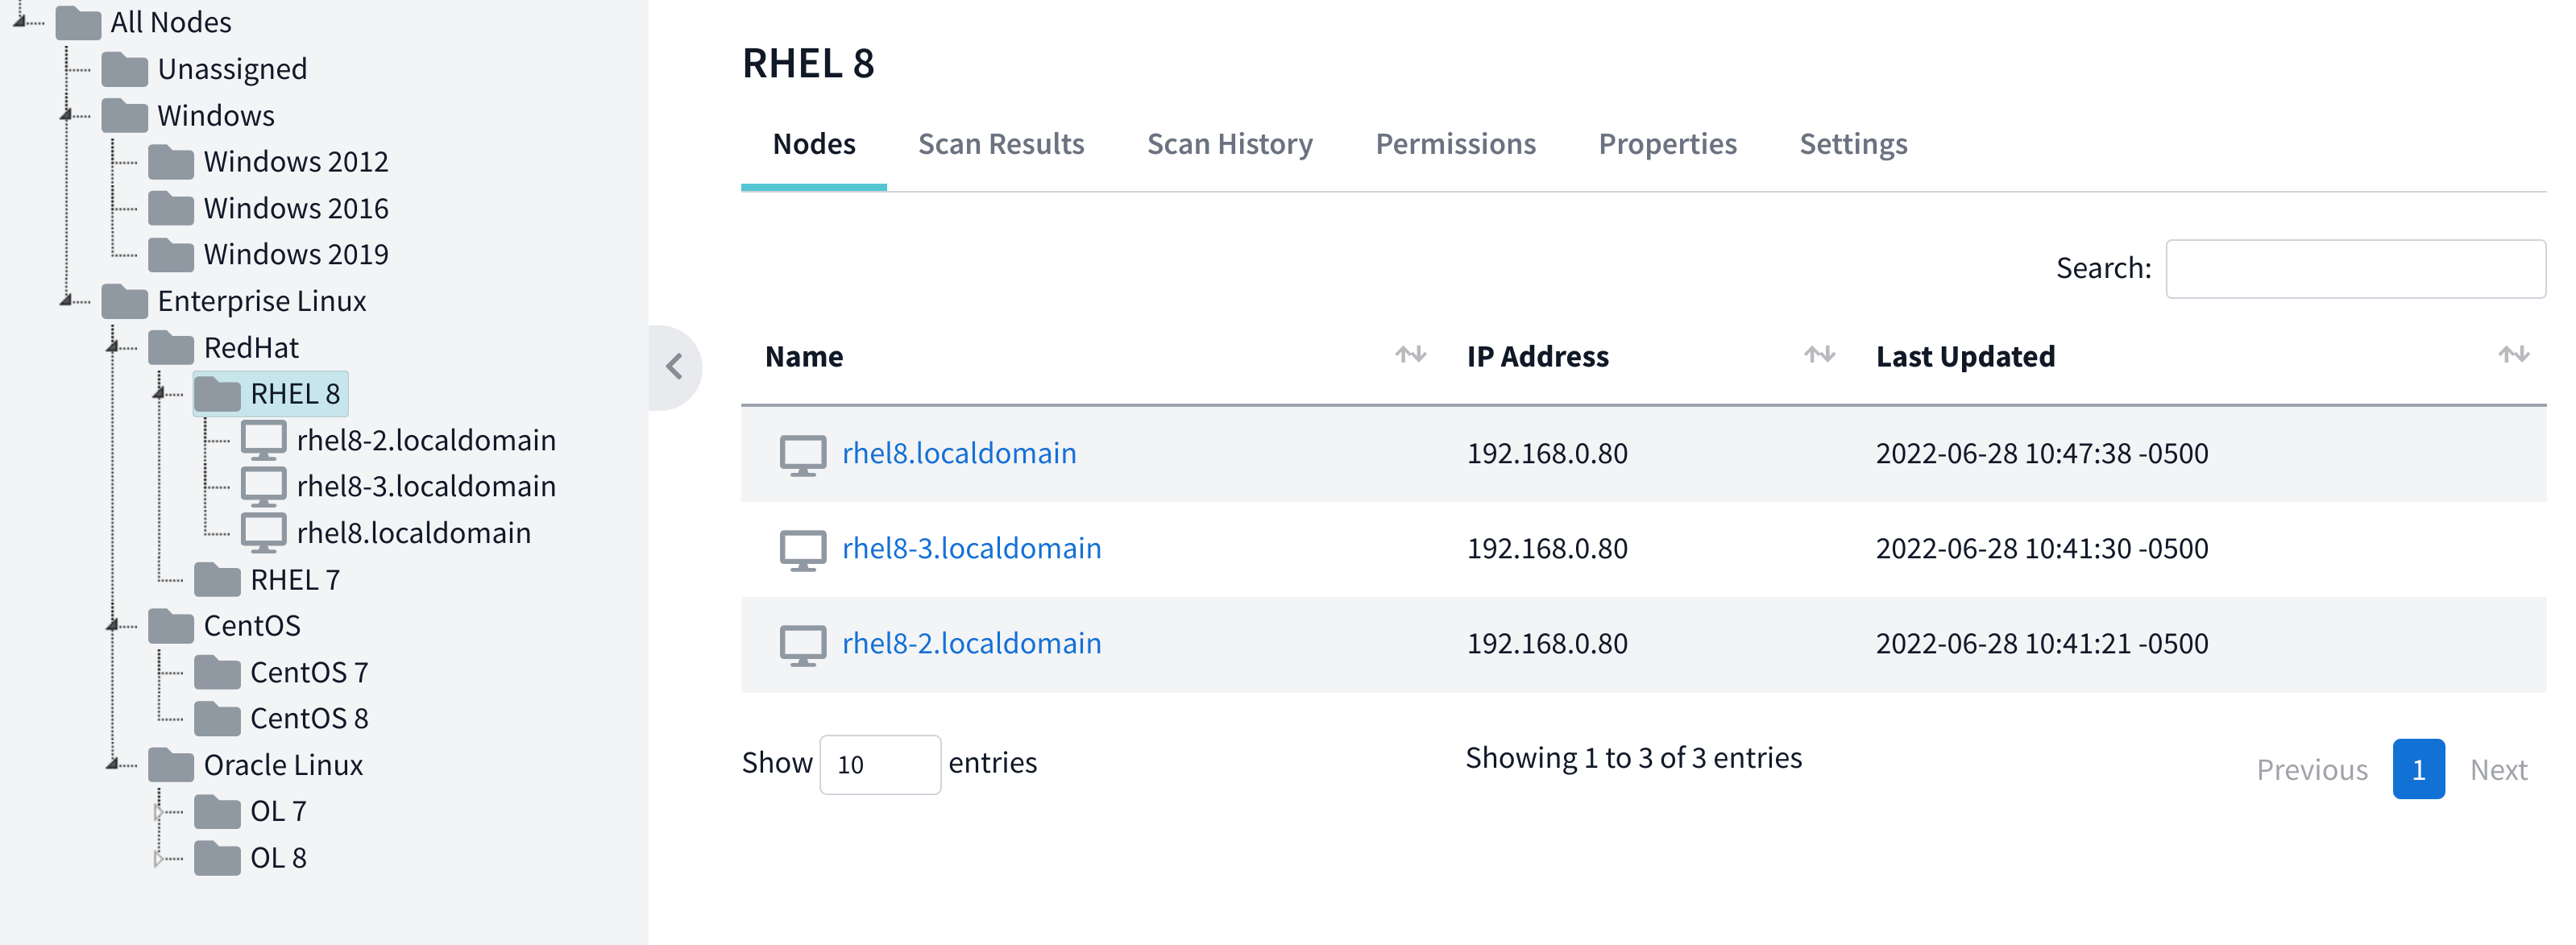
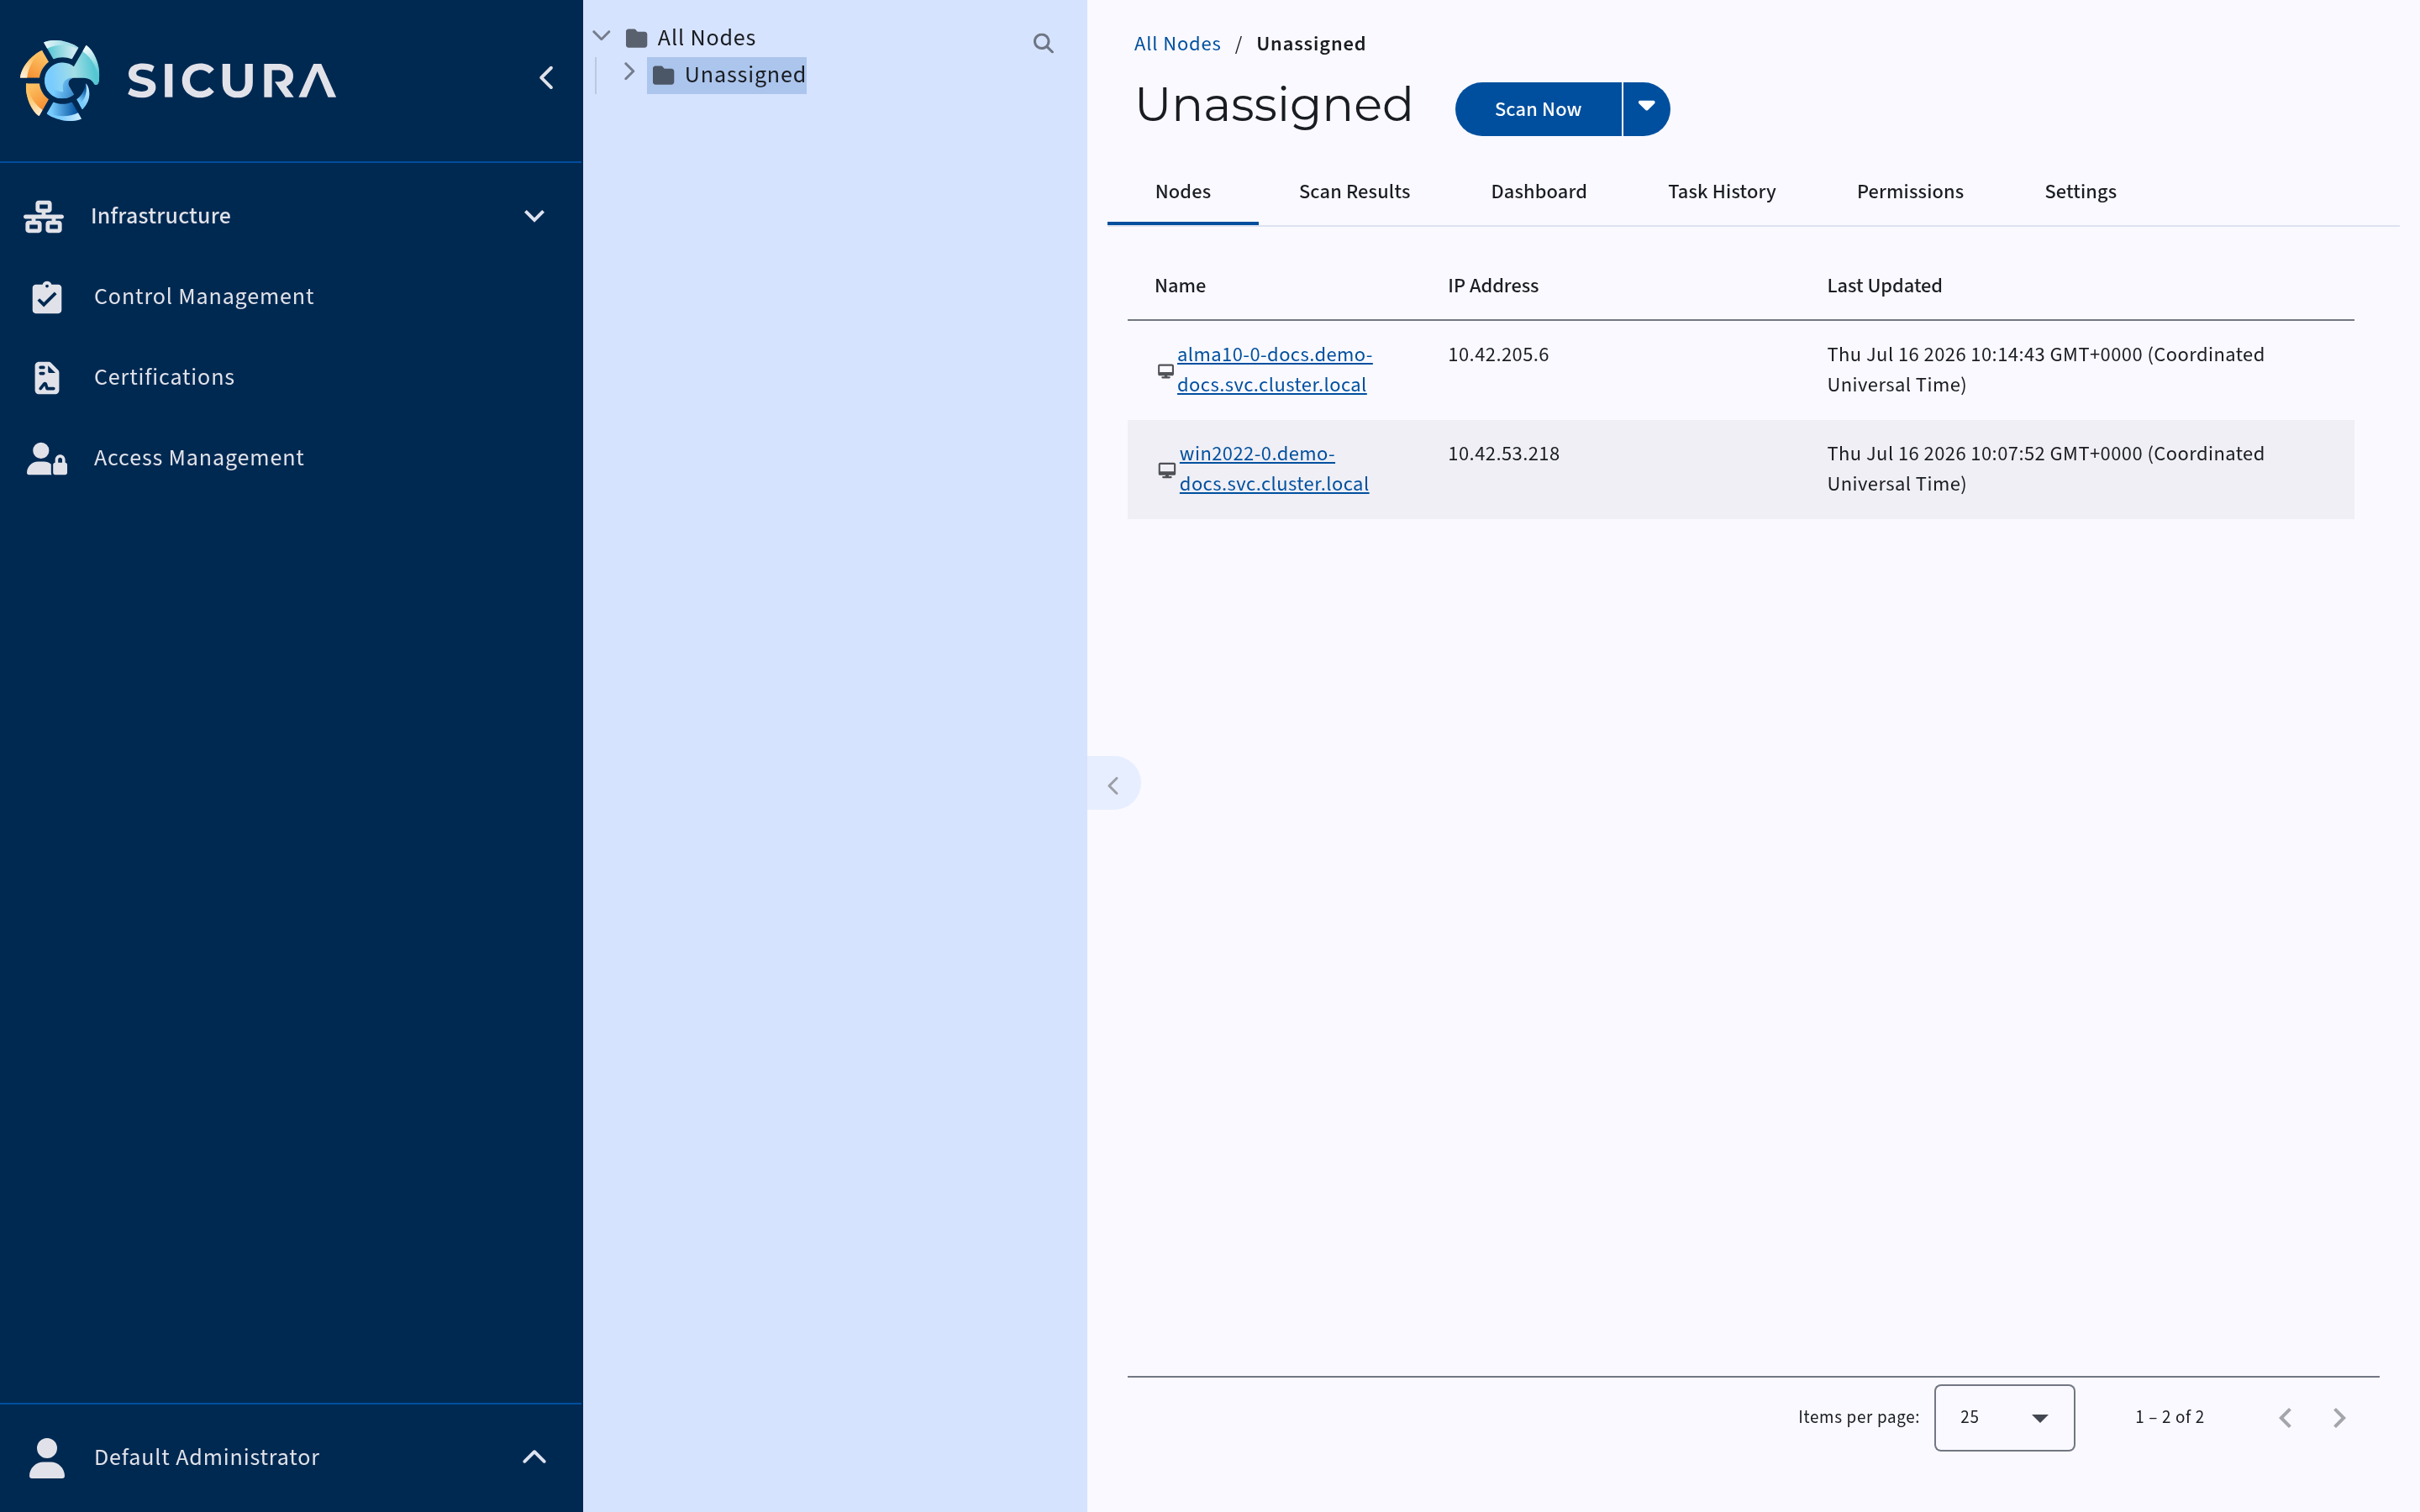
The Nodes tab provides an overview of all nodes contained inside. The node name, IP address for that node, and last update date can be seen from this table.
Scan Results
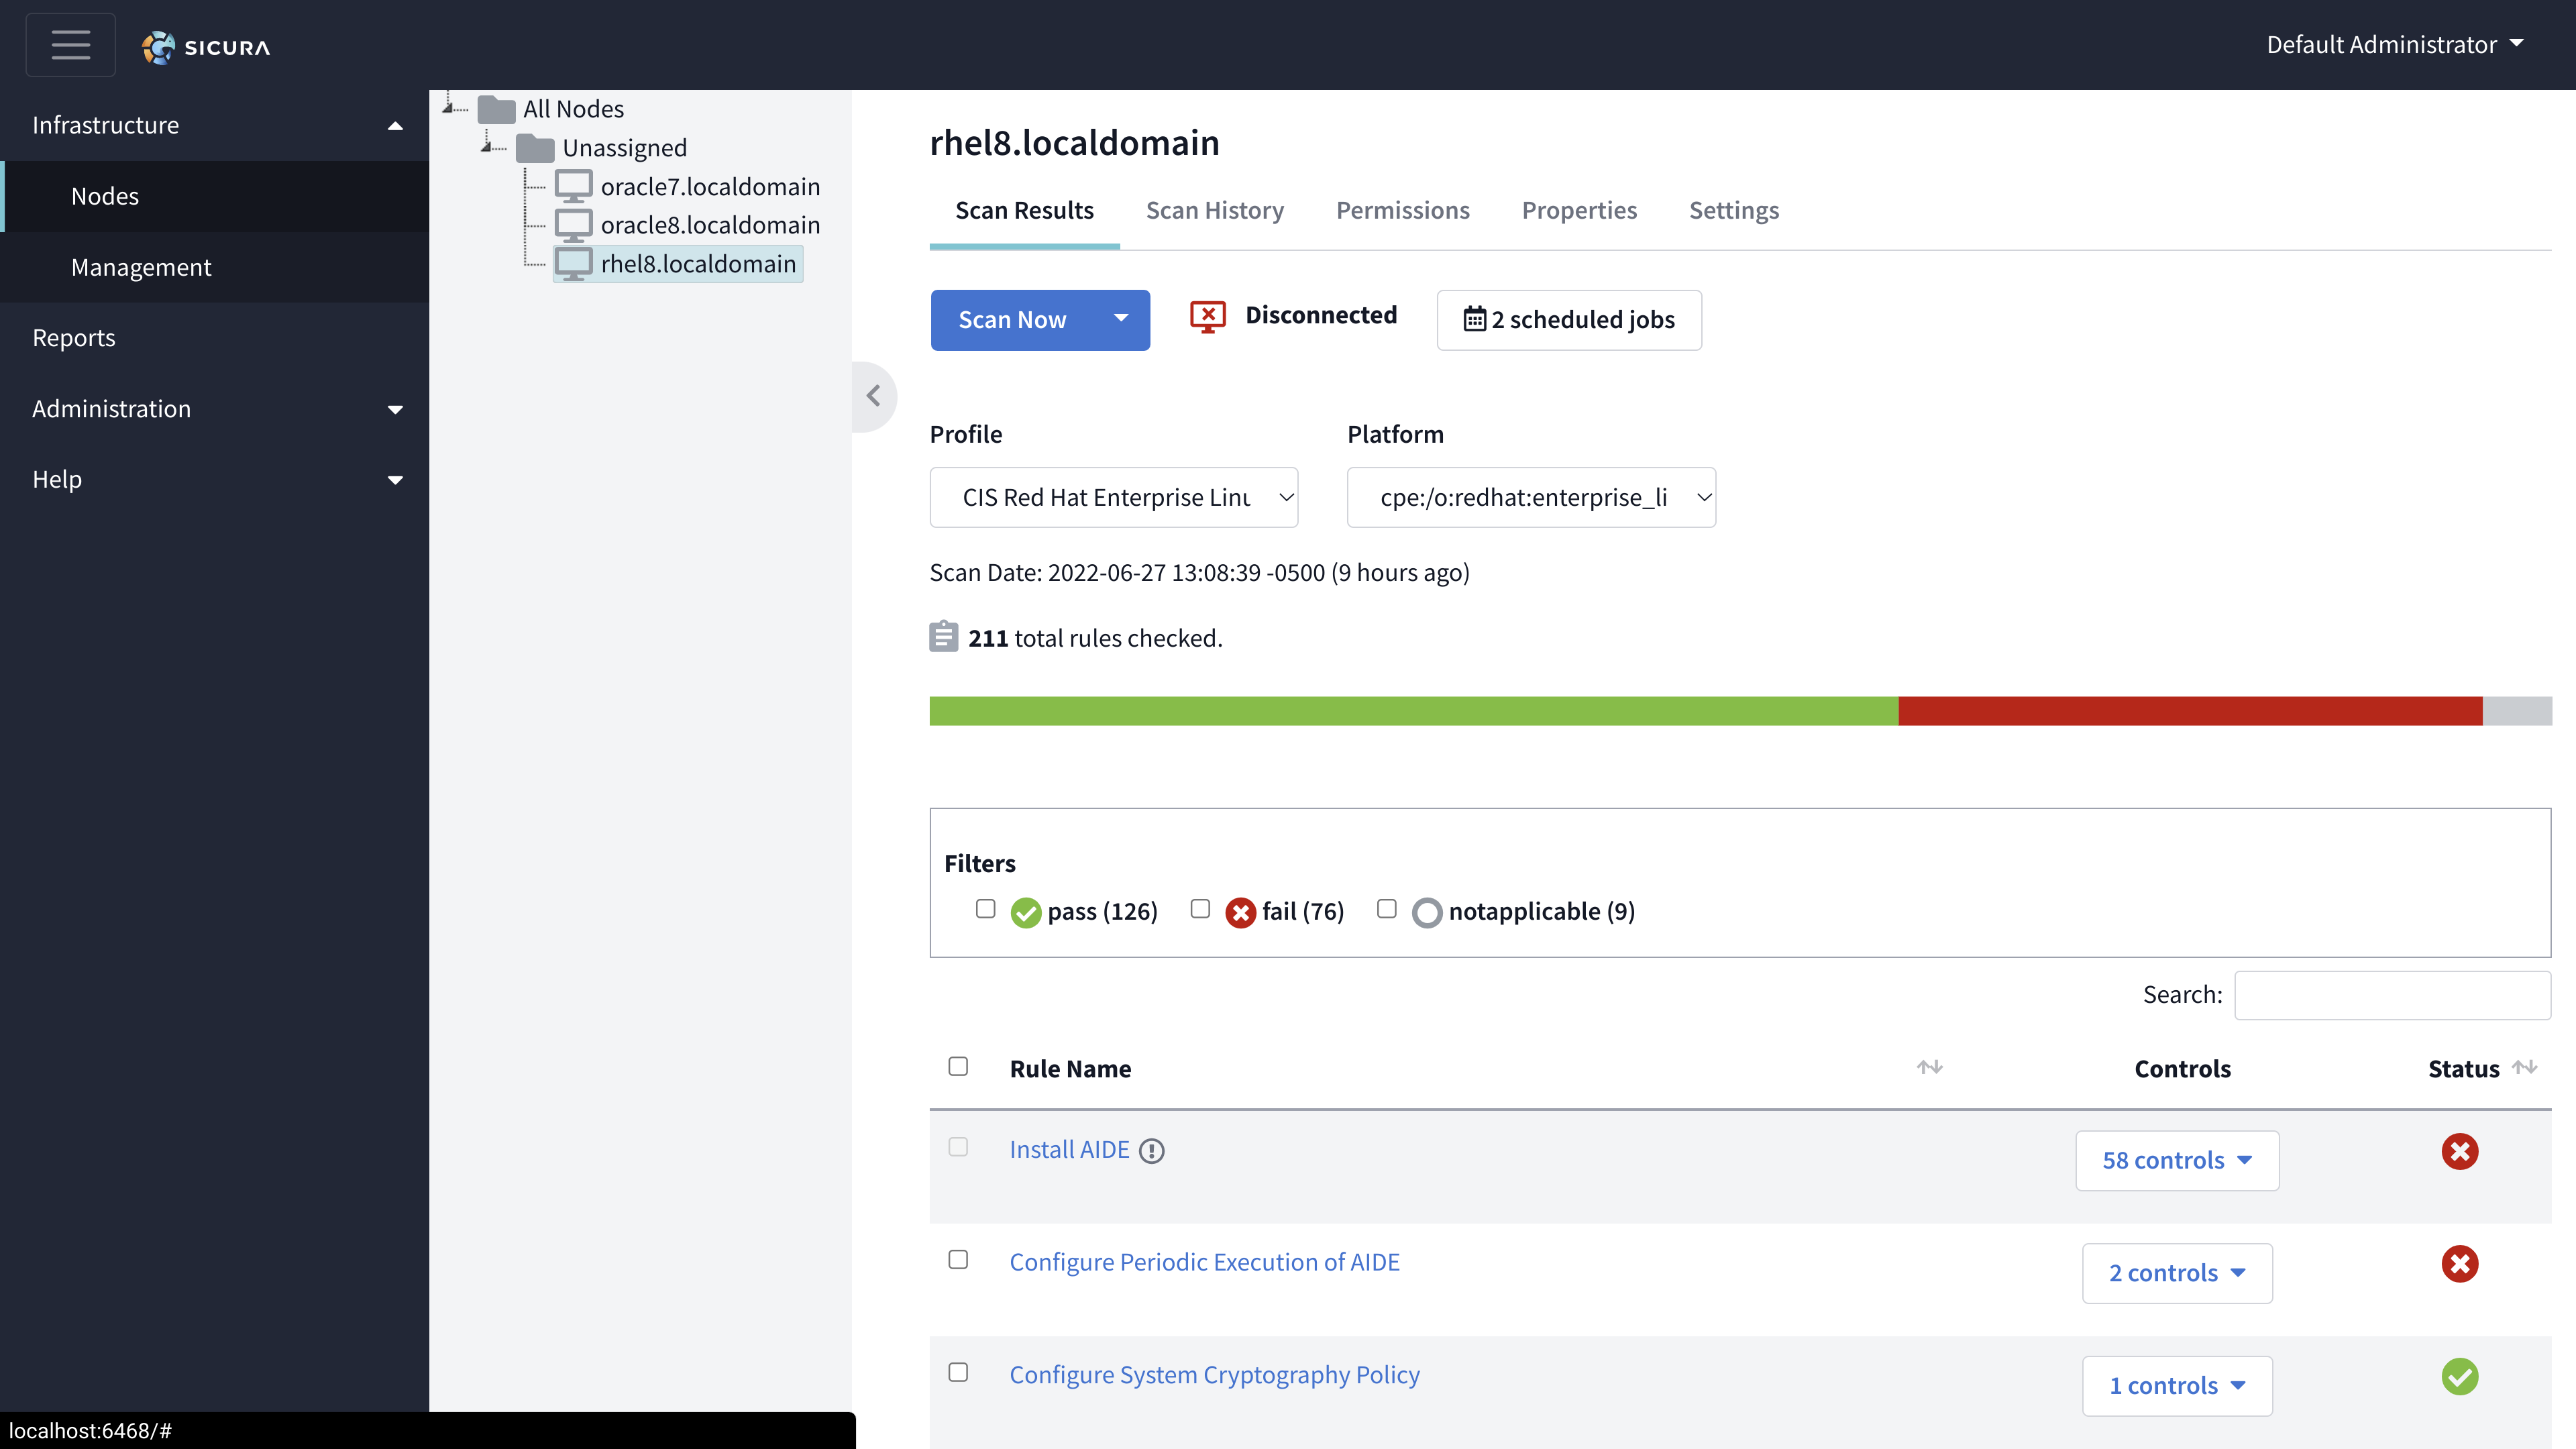
The Scan Results tab is used to view the SCAP results from the Sicura Agent.
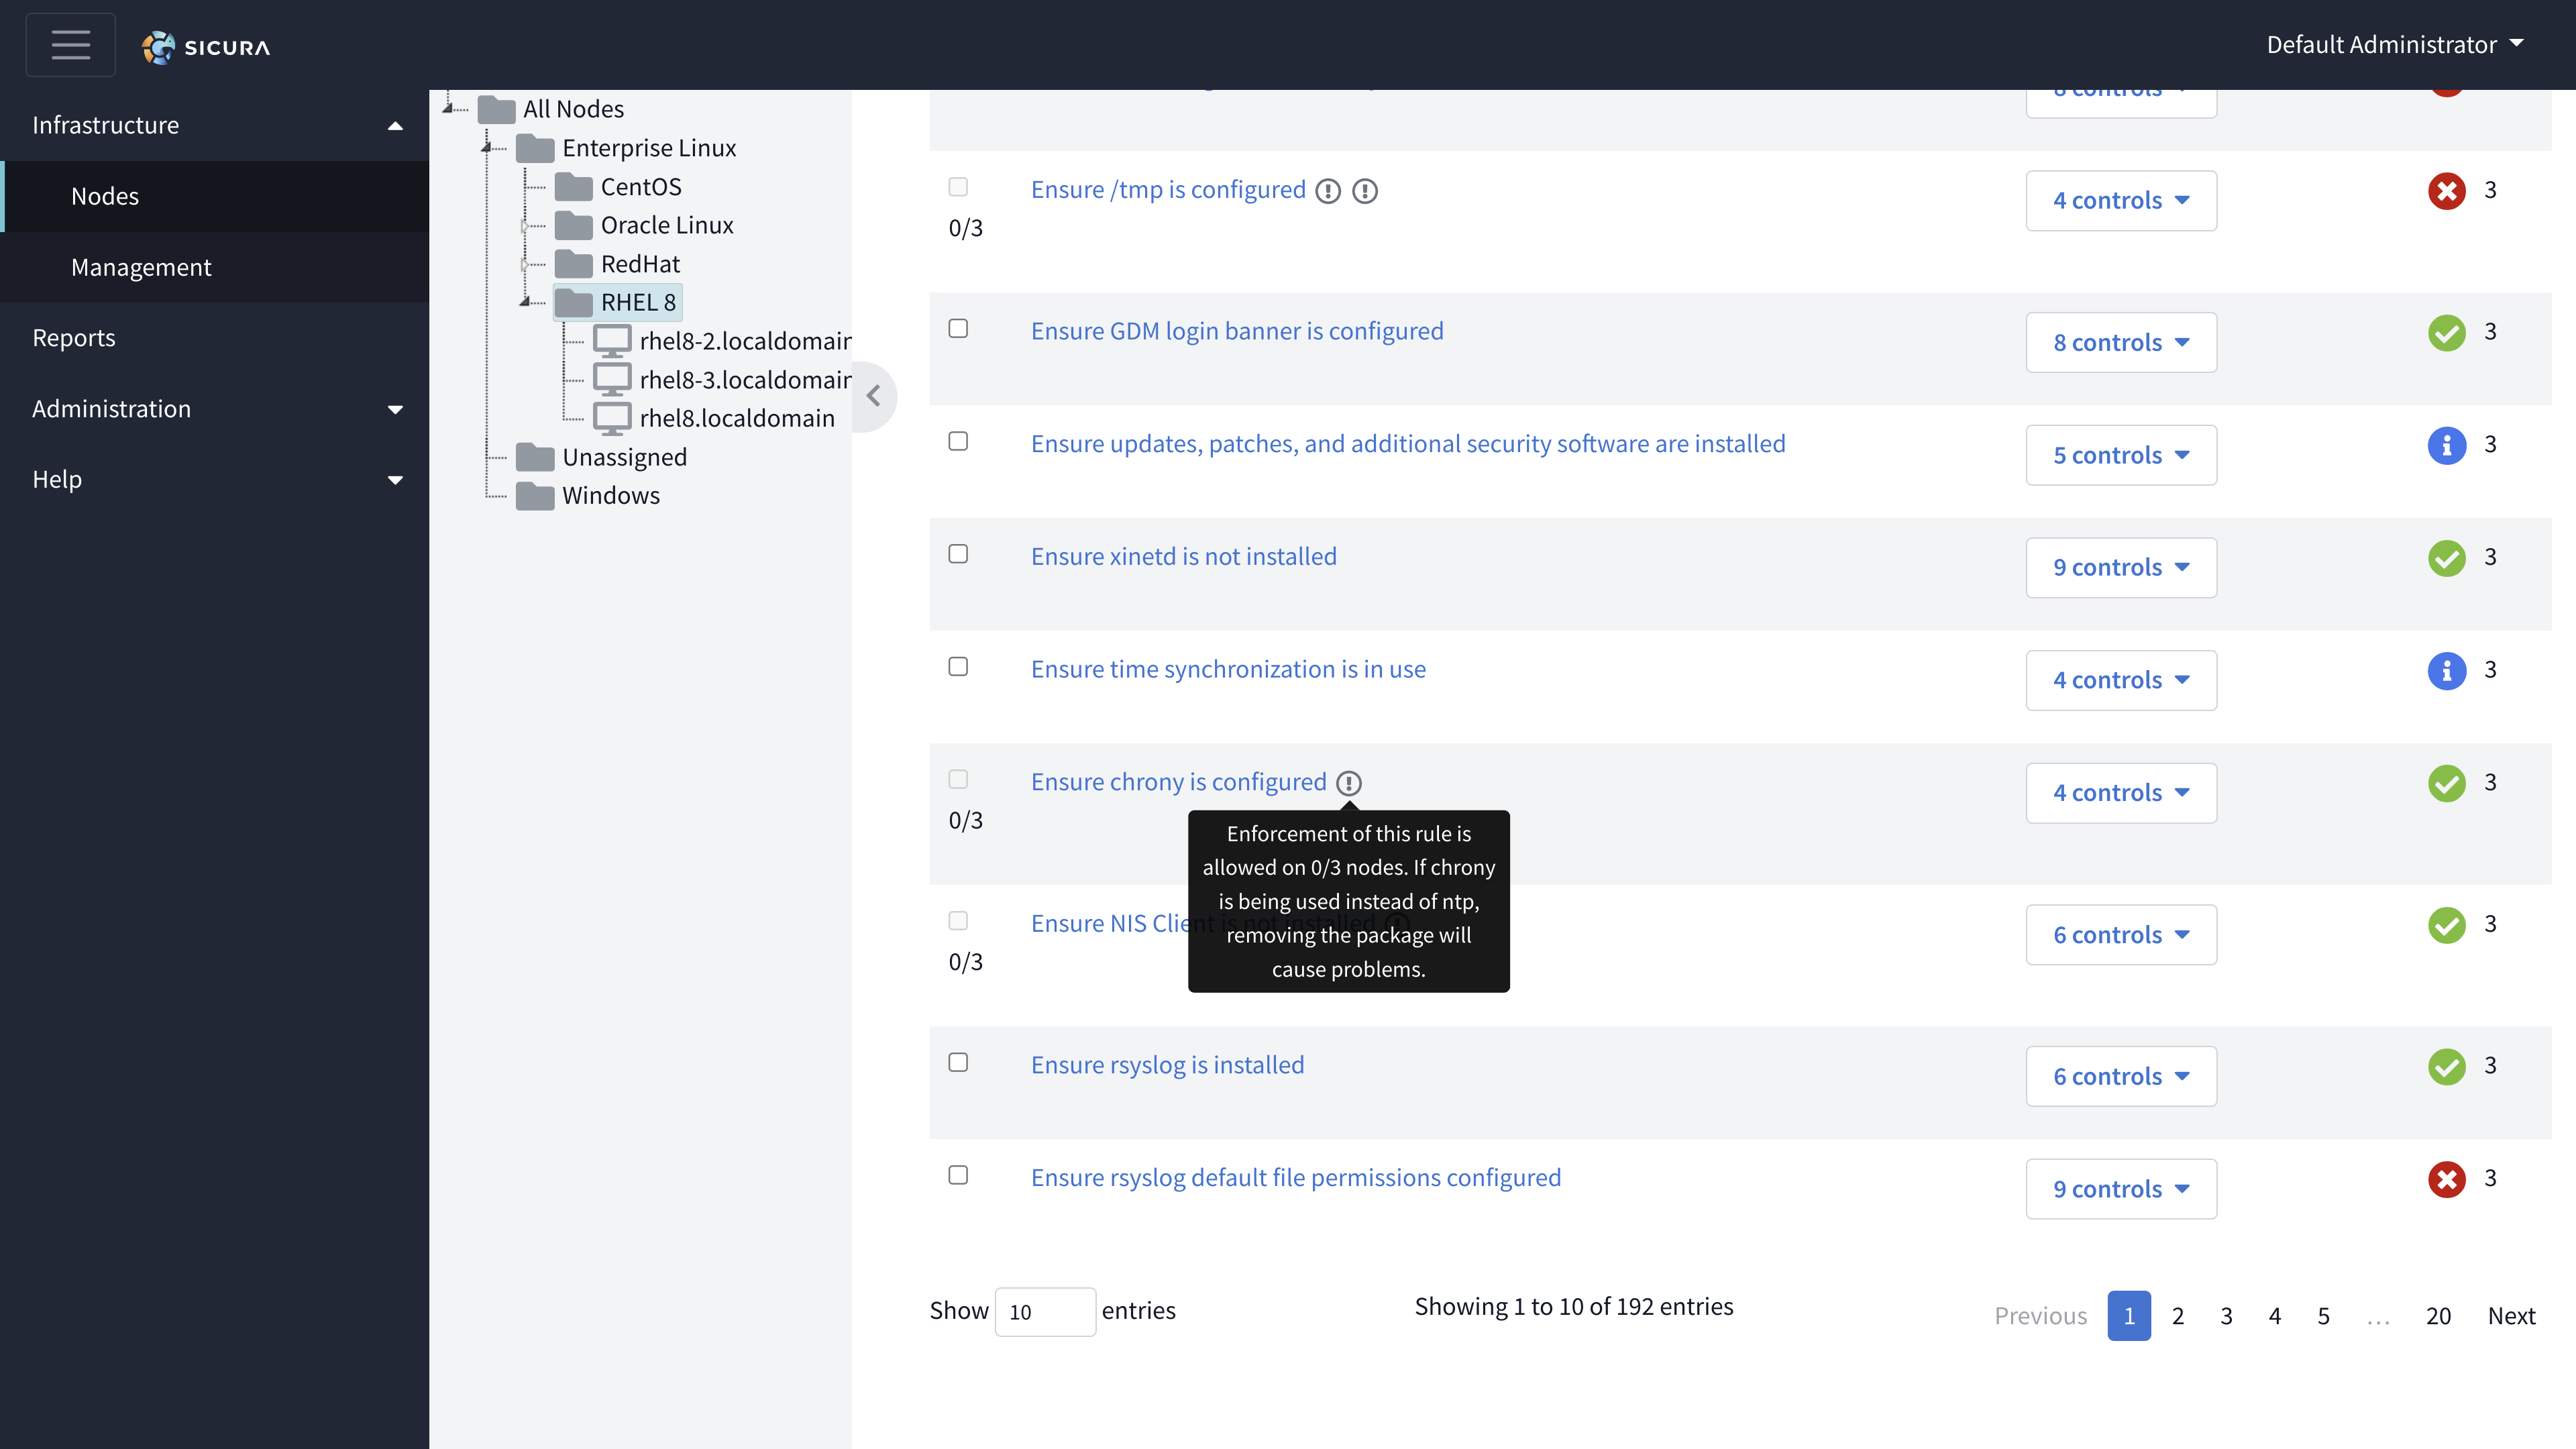
For folders, the Status column in the table will show how many nodes contained within are passing, failing, not-applicable, etc.
Based on Enforcement Tolerance set within the Settings tab. Different rules can be remediated on some systems where others may not.
This is represented by the number displayed below the remediation checkbox
-
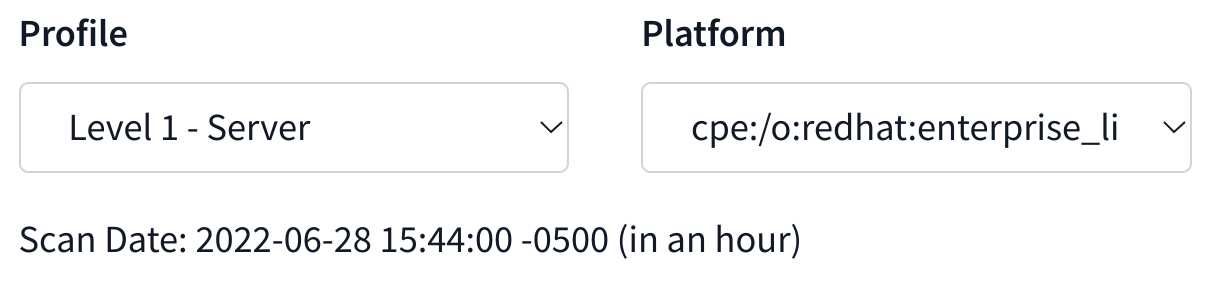
Profile dropdown — This is the compliance profile as reported from Sicura Agent that the scan was done against. If different compliance profiles have been scanned the results can be updated by selecting from here.
-
Scan Date — This is the date and time in which the scan was completed. This may be different than the time the scan was submitted.
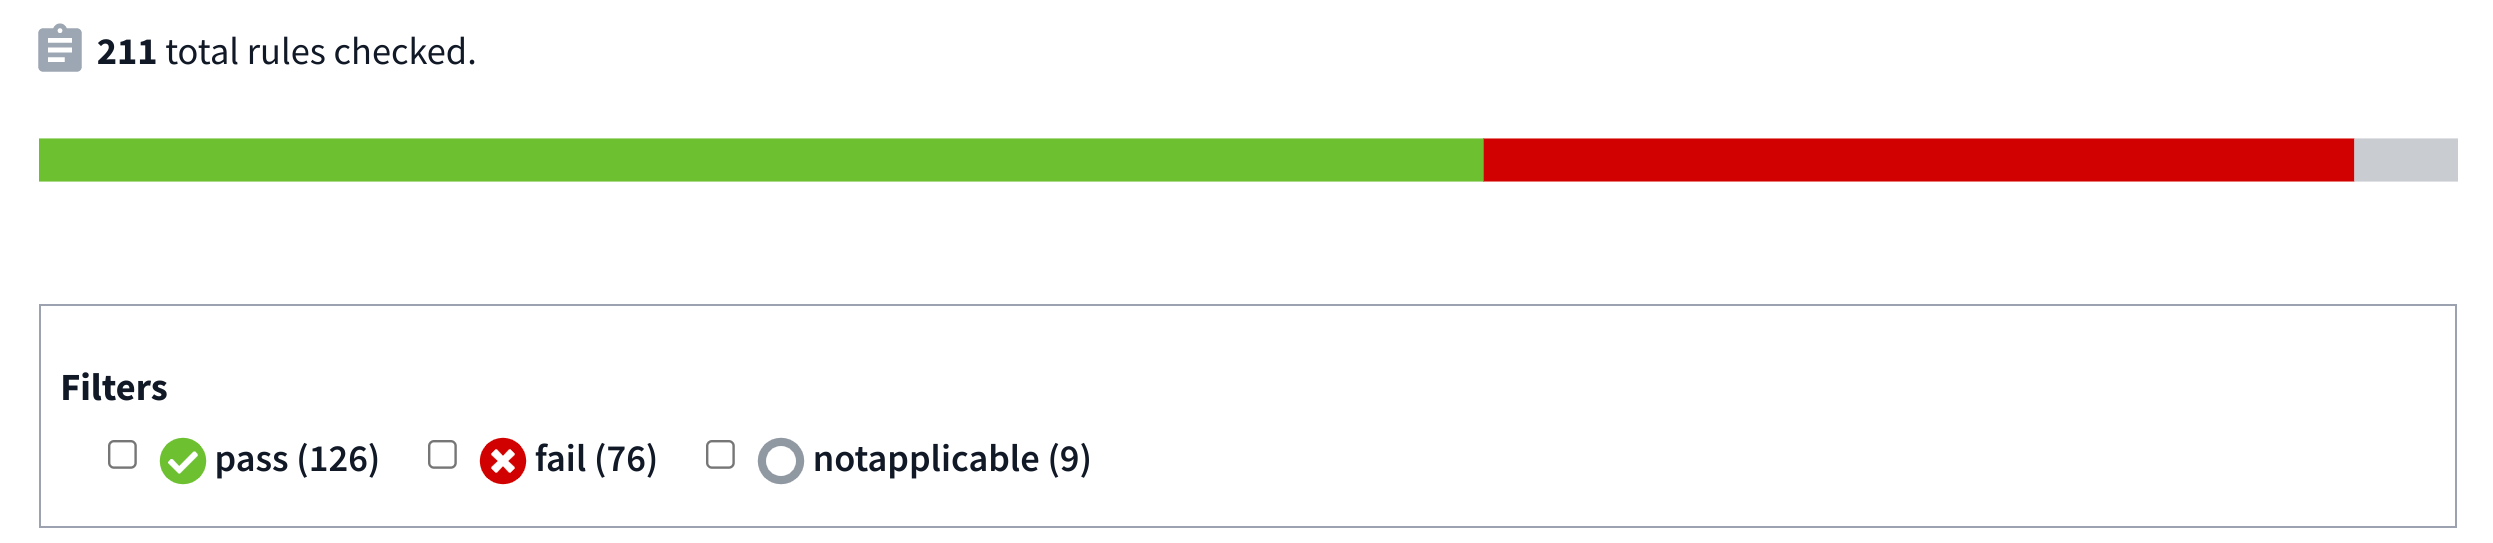
The scan details show an overview of pass/fail status across all the checks from the scan. The scan details also provide filtering options so you can view results by specifying what you want to see.
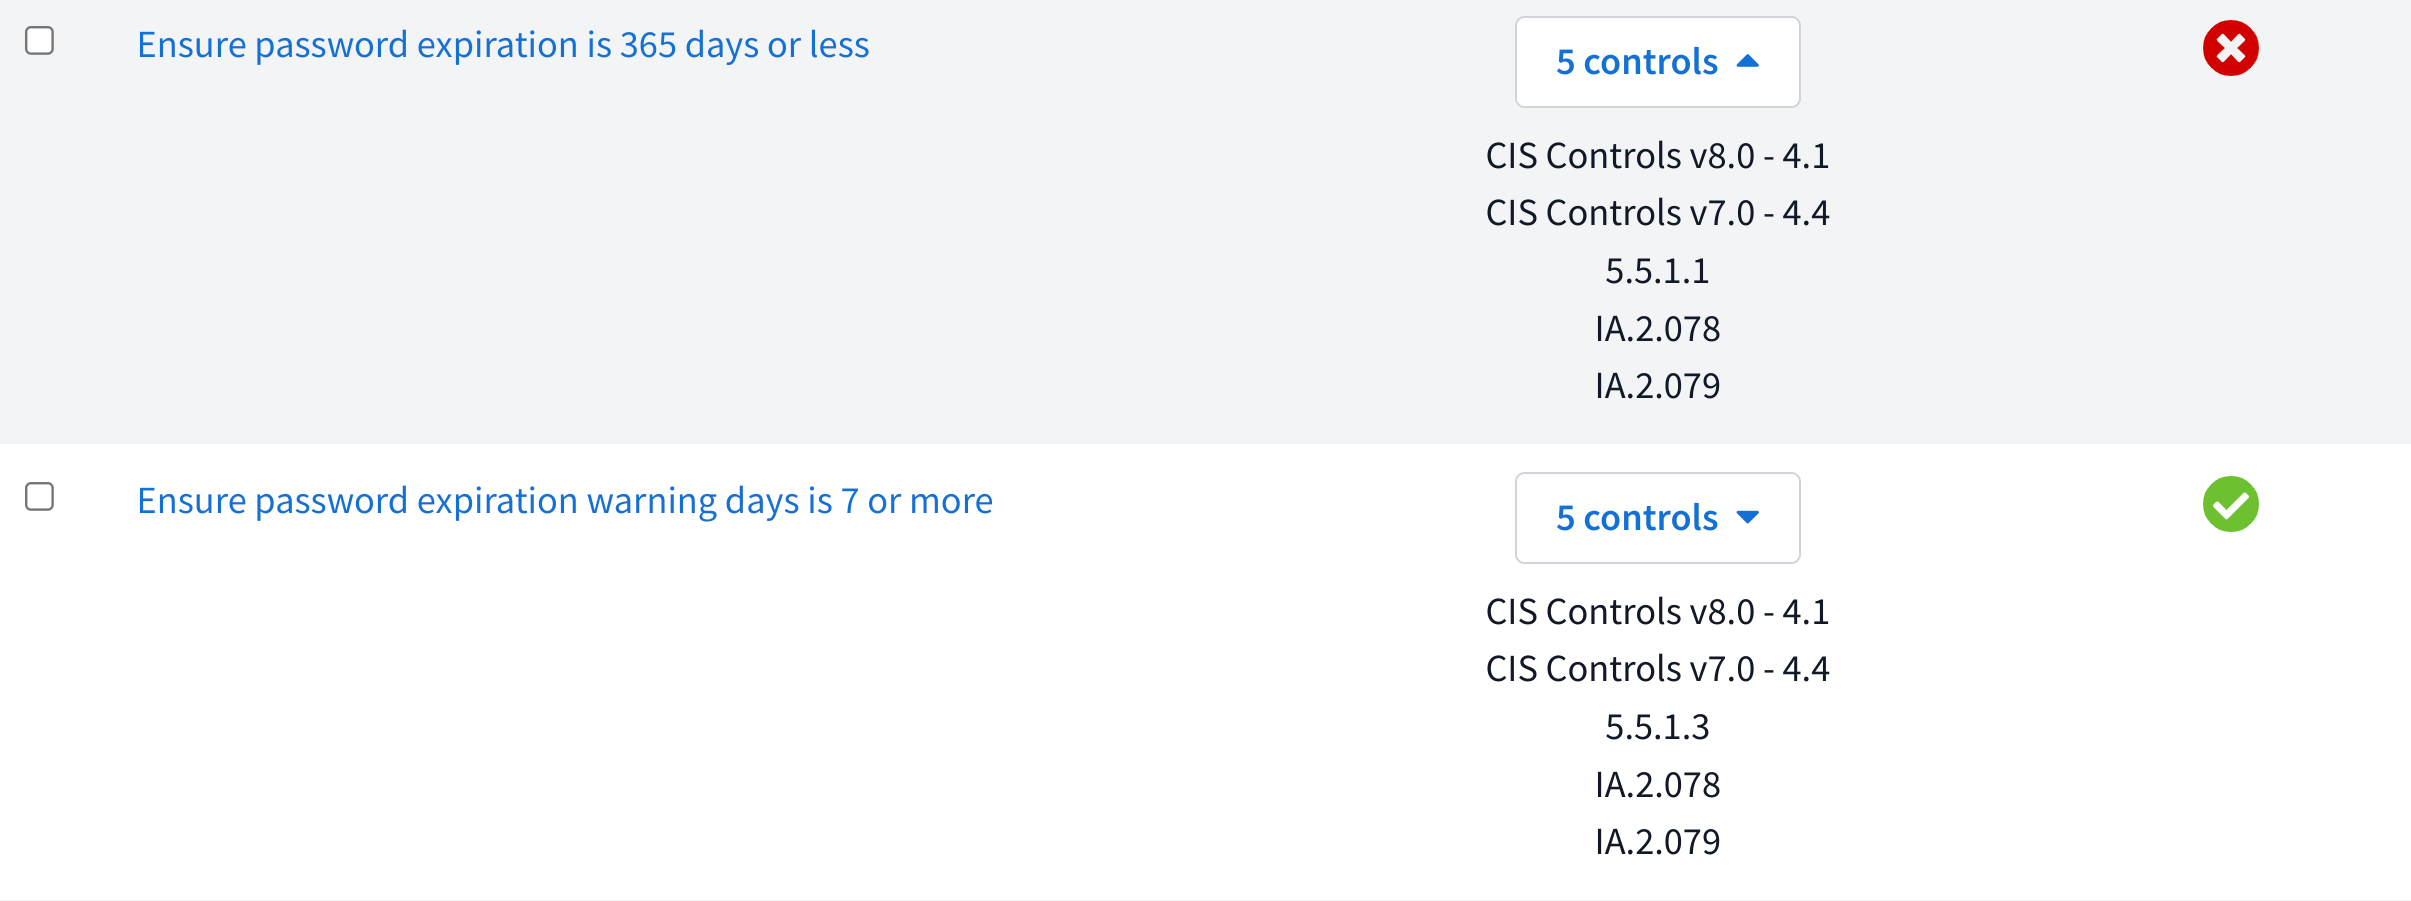
The table provides a list of each check that was evaluated during the scan.
-
Title — The name of the rule. Click it to expand a description of what the rule aims to ensure.
-
Controls — Lists the compliance controls this rule is relevant to. Click to expand the full list.
-
Result — Shows passing/failing/other status based on the results of the scan.
Scan Drawer
After clicking a specific rule, this drawer opens to provide more information. The drawer has two sections:
Details
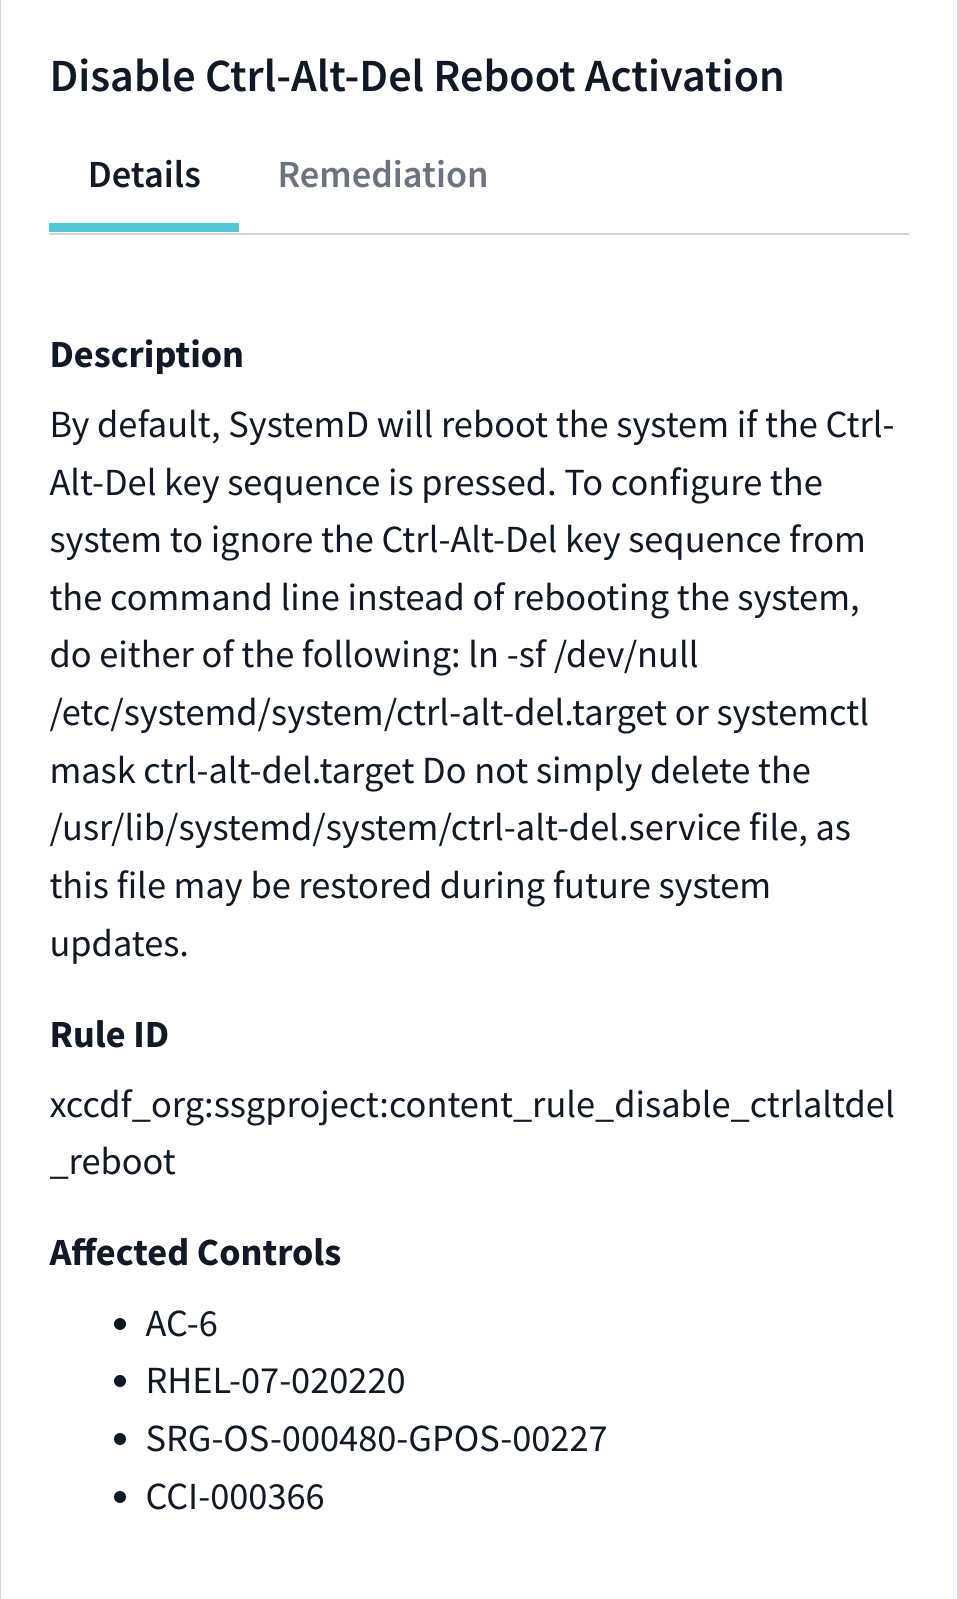
Under this section you'll find:
- The description, which provides details on the check's purpose and how it can be fixed manually.
- The XCCDF ID for easy identification.
- A list of controls this rule affects.
Remediation
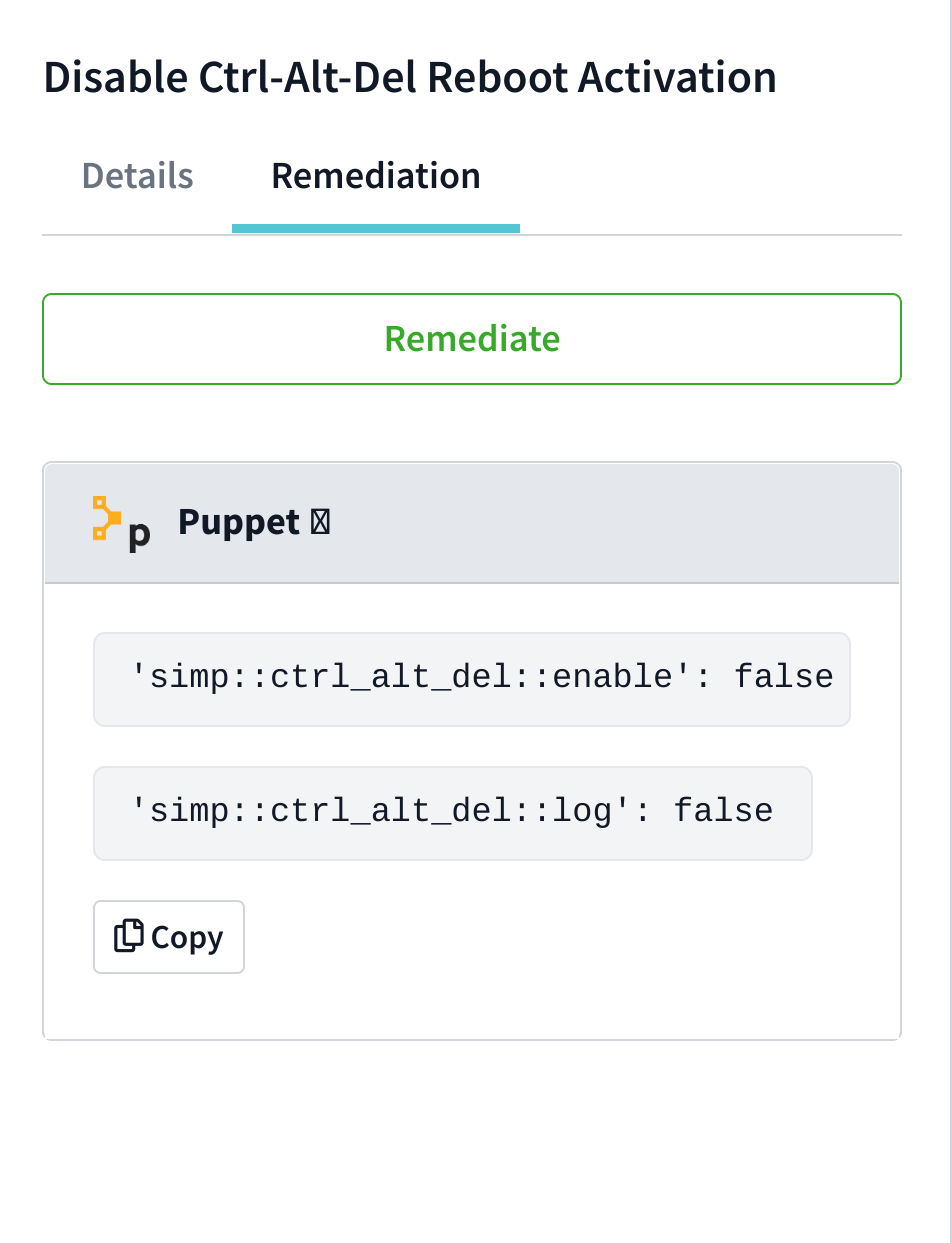
Under this section you'll find:
- The Remediate button (if enabled in the config and the user has the role feature enabled), which can be used to automatically fix the finding on the specified node.
- The relevant Puppet Hiera data, which can be easily copied and pasted into your infrastructure code for continuous enforcement.
Job History
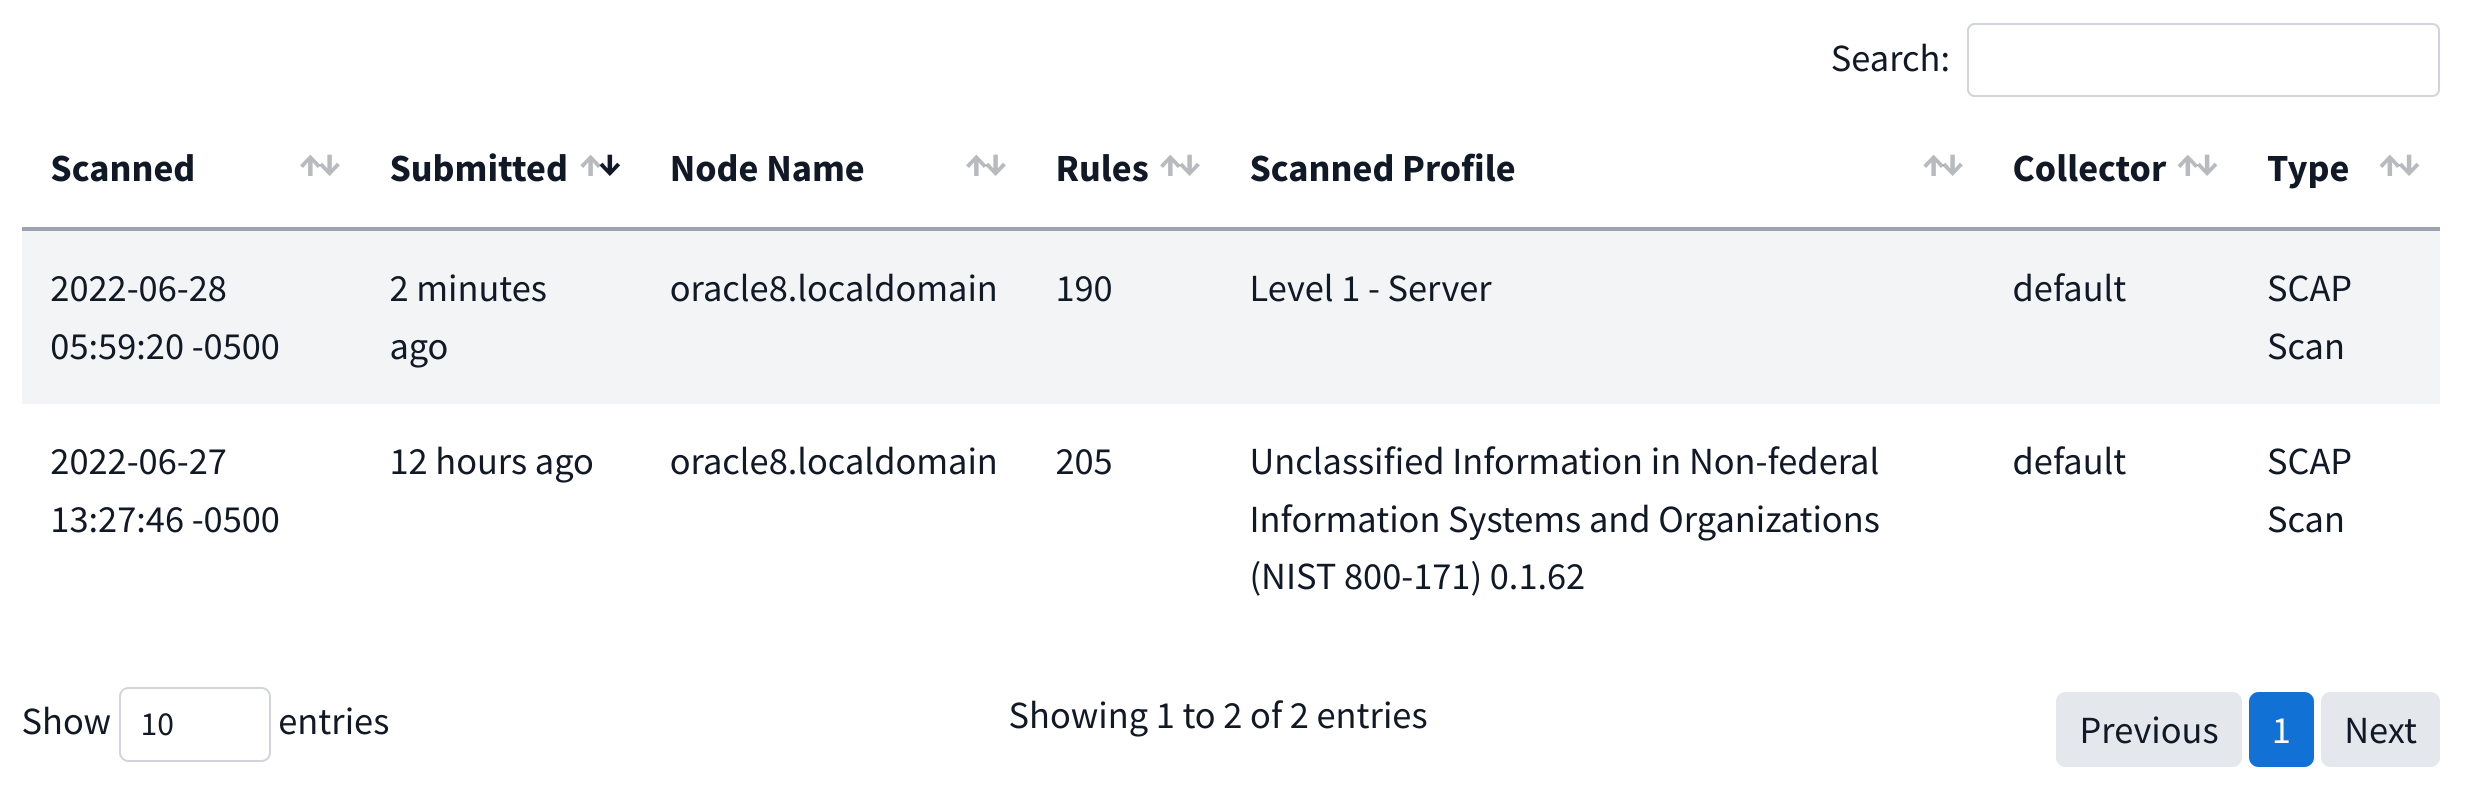
The Job History tab (labeled Task History on folders) provides a quick way to view the past scans done on a node (or nested nodes in the case of a folder). It provides the date/time of scan and submission, which node the scan ran on, how many rules were checked in the scan, what compliance profile the scan was done against, and the collector it was submitted to.
Permissions
The Permissions tab is used (generally by administrators) to set up what roles different users and groups can have on any given node. The table shows the list of all permissions set. By default there is one permission that gives the group Administrators the role of Admin over all nodes and their subsequent children.
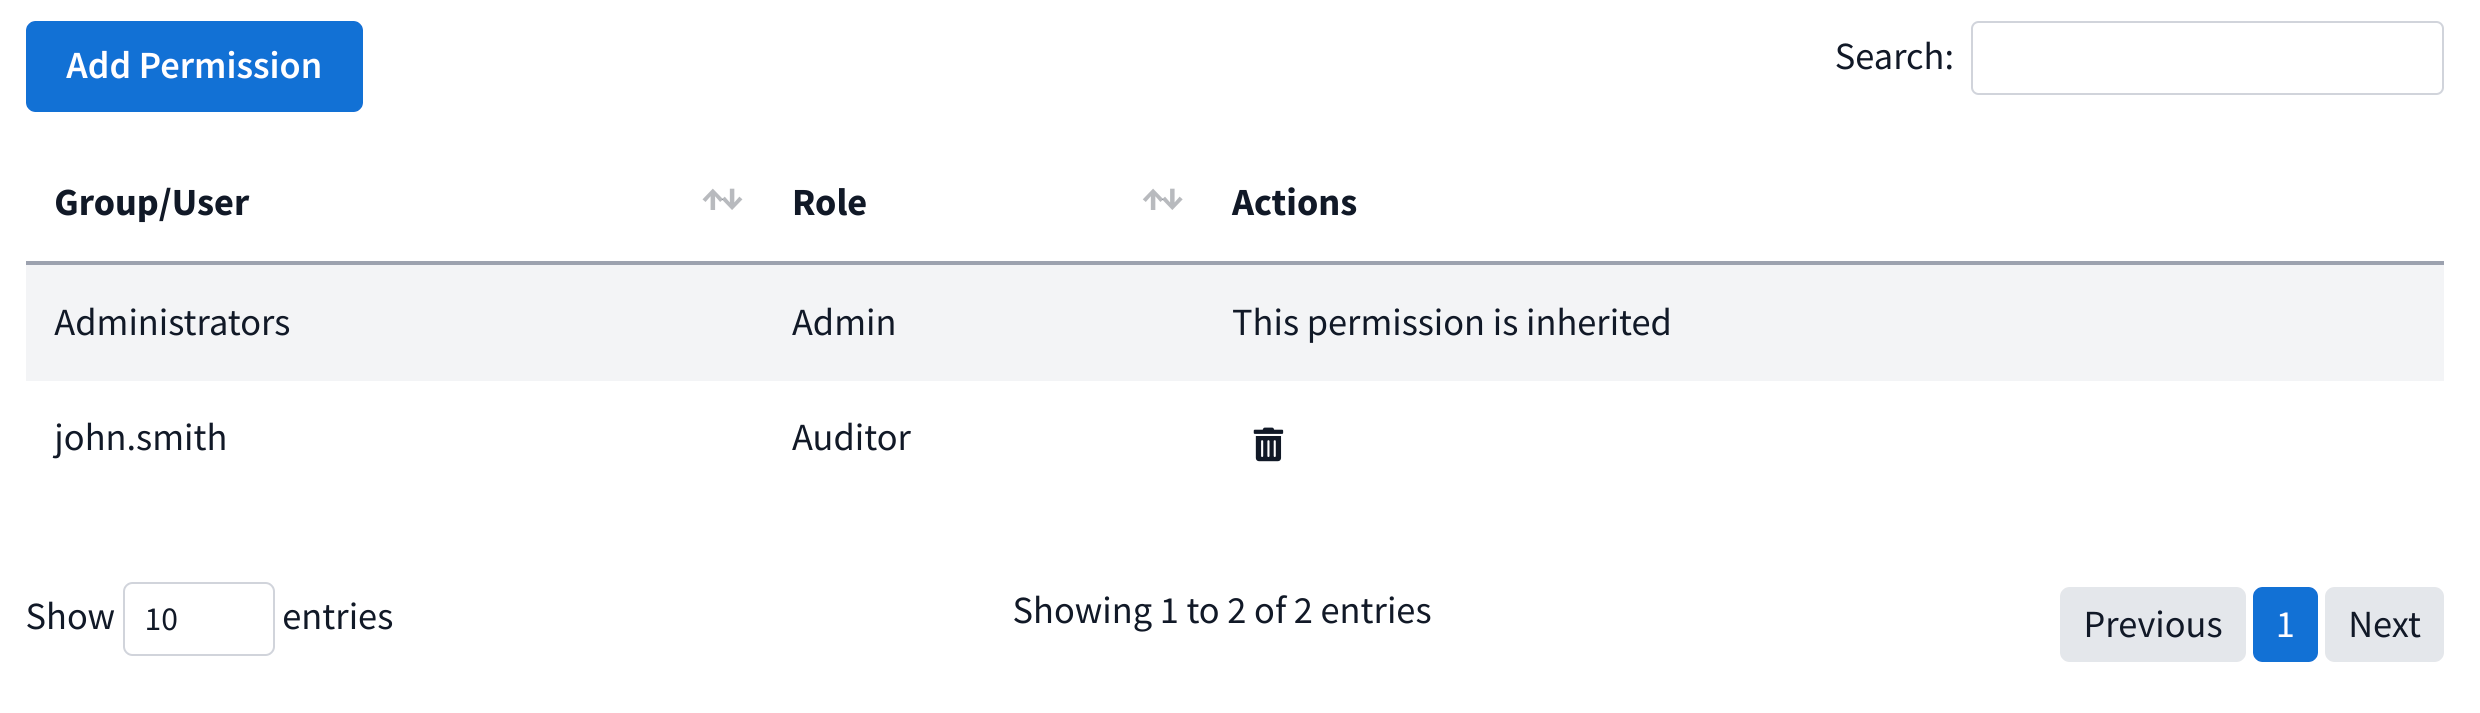
By clicking Add Permission, you'll be able to add additional Users/Groups to roles for this node. These permissions will be inherited down the tree.
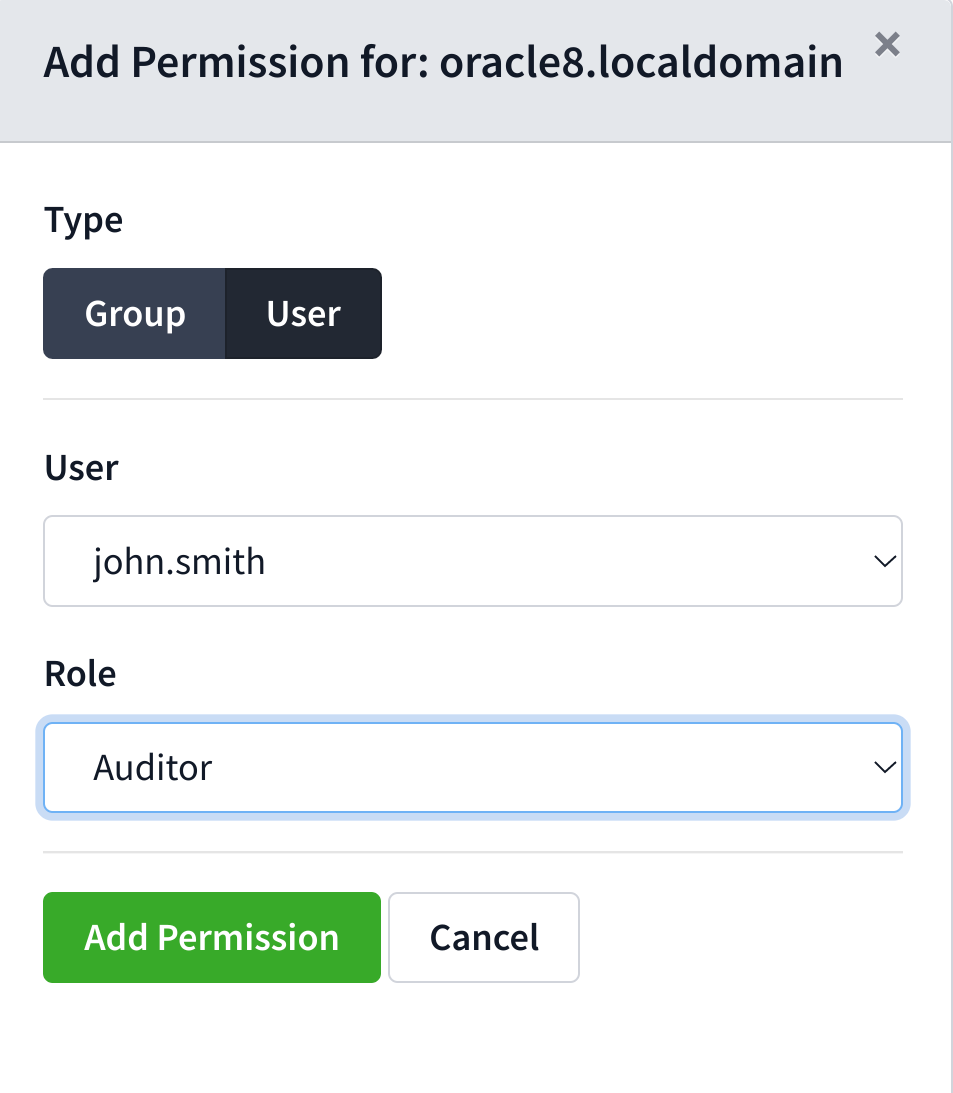
Note: Your current session needs to have 'UPDATE' privileges in order to assign new permissions. Otherwise you'll only be able to view them.
Properties
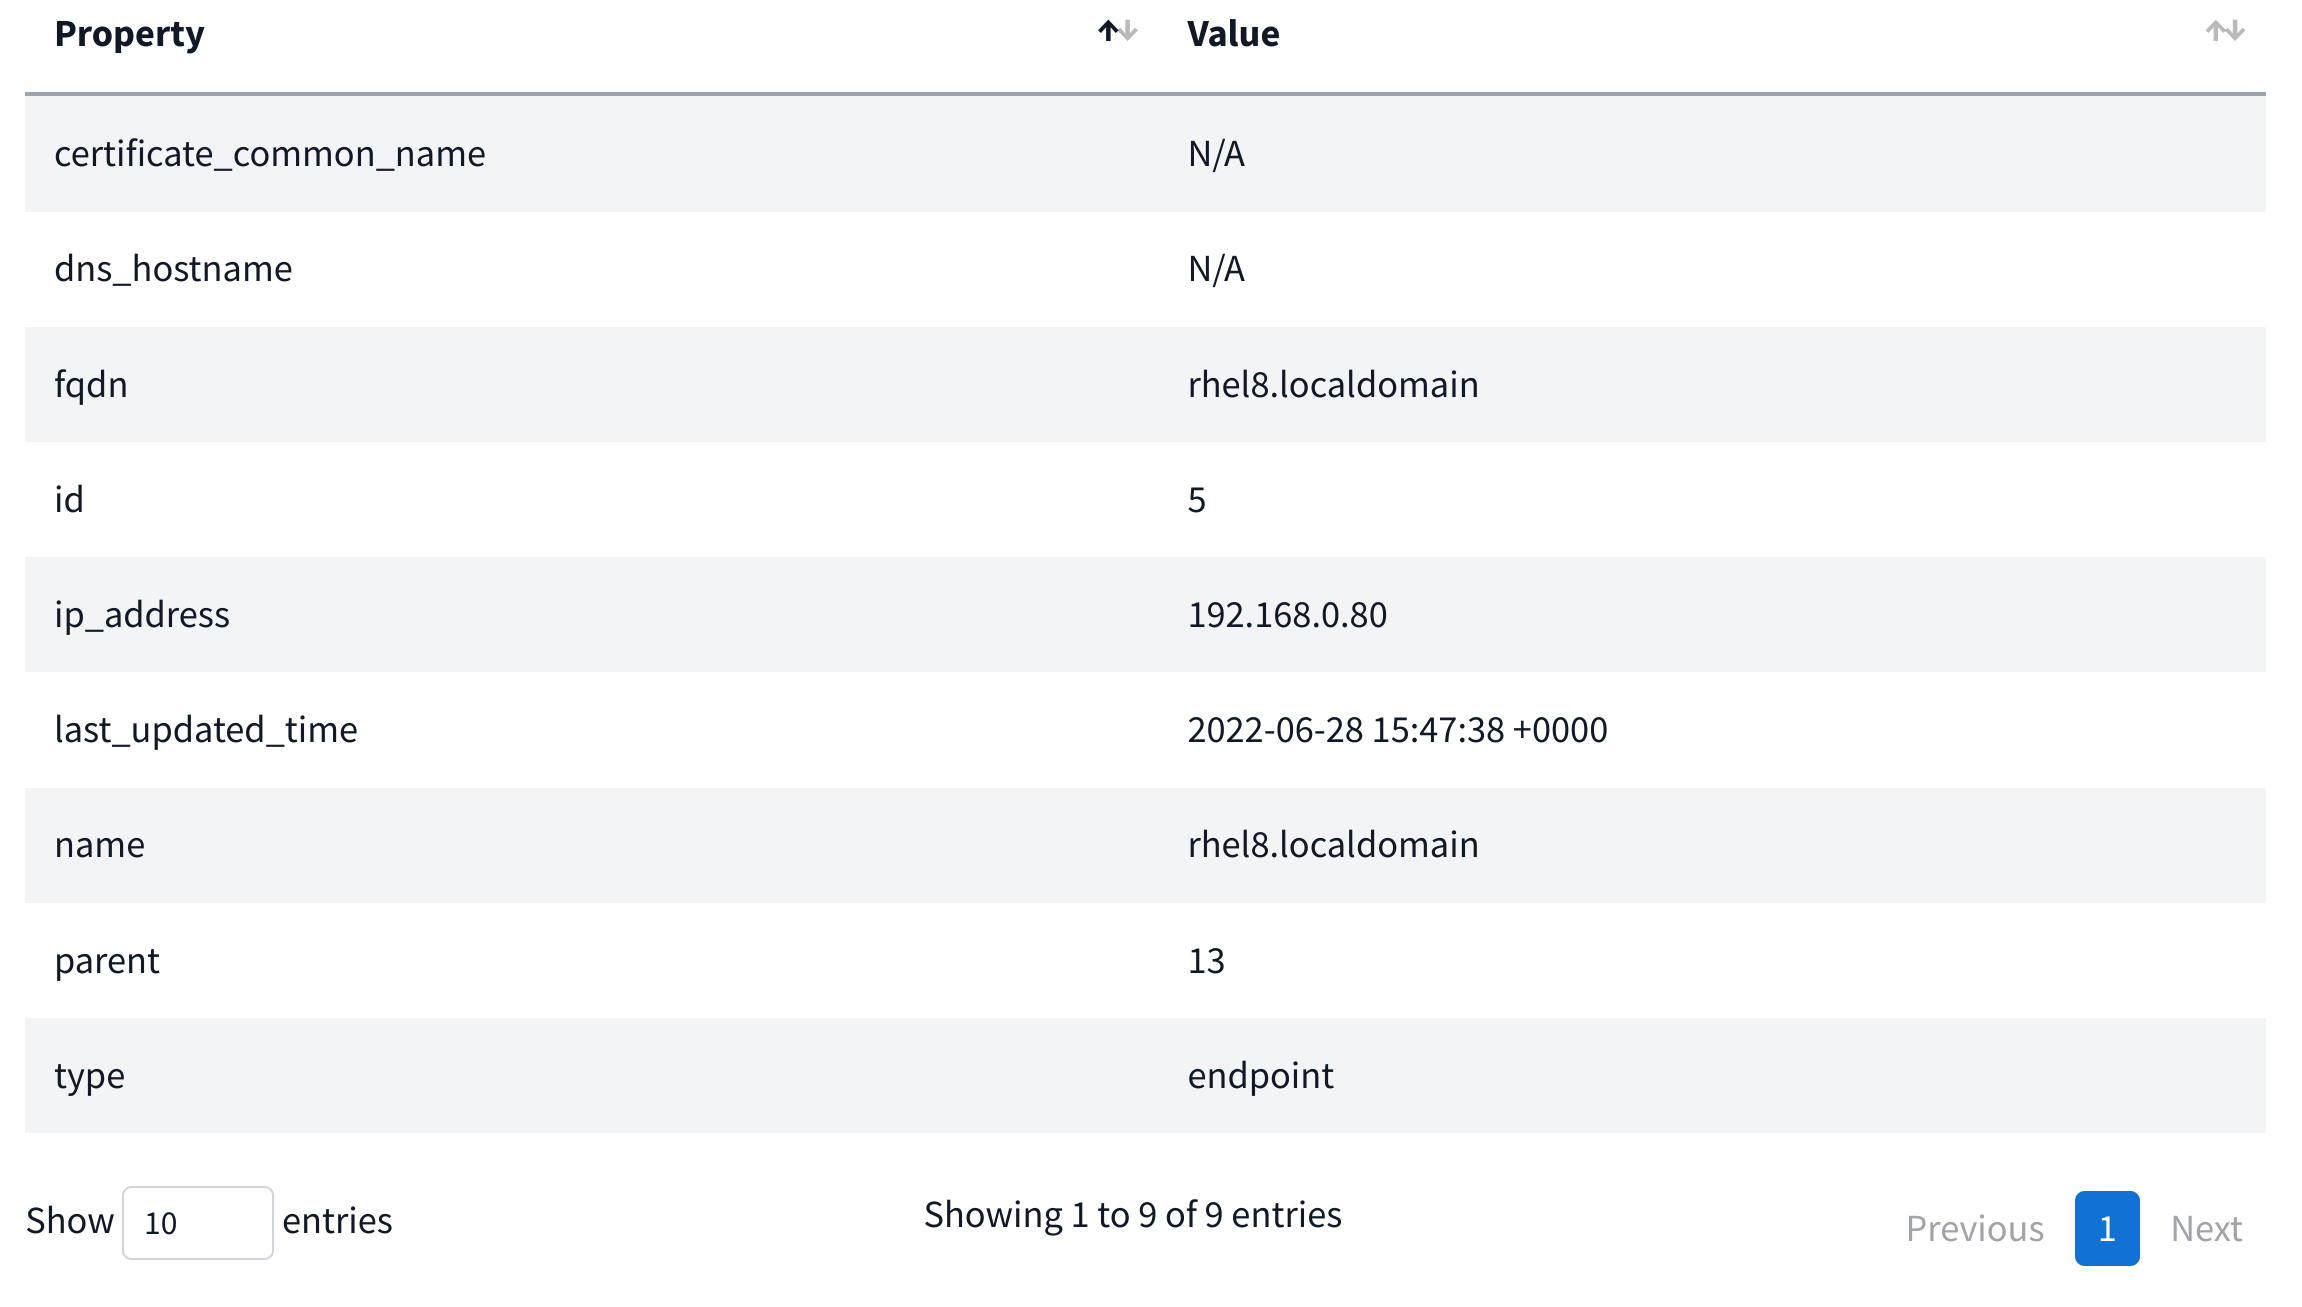
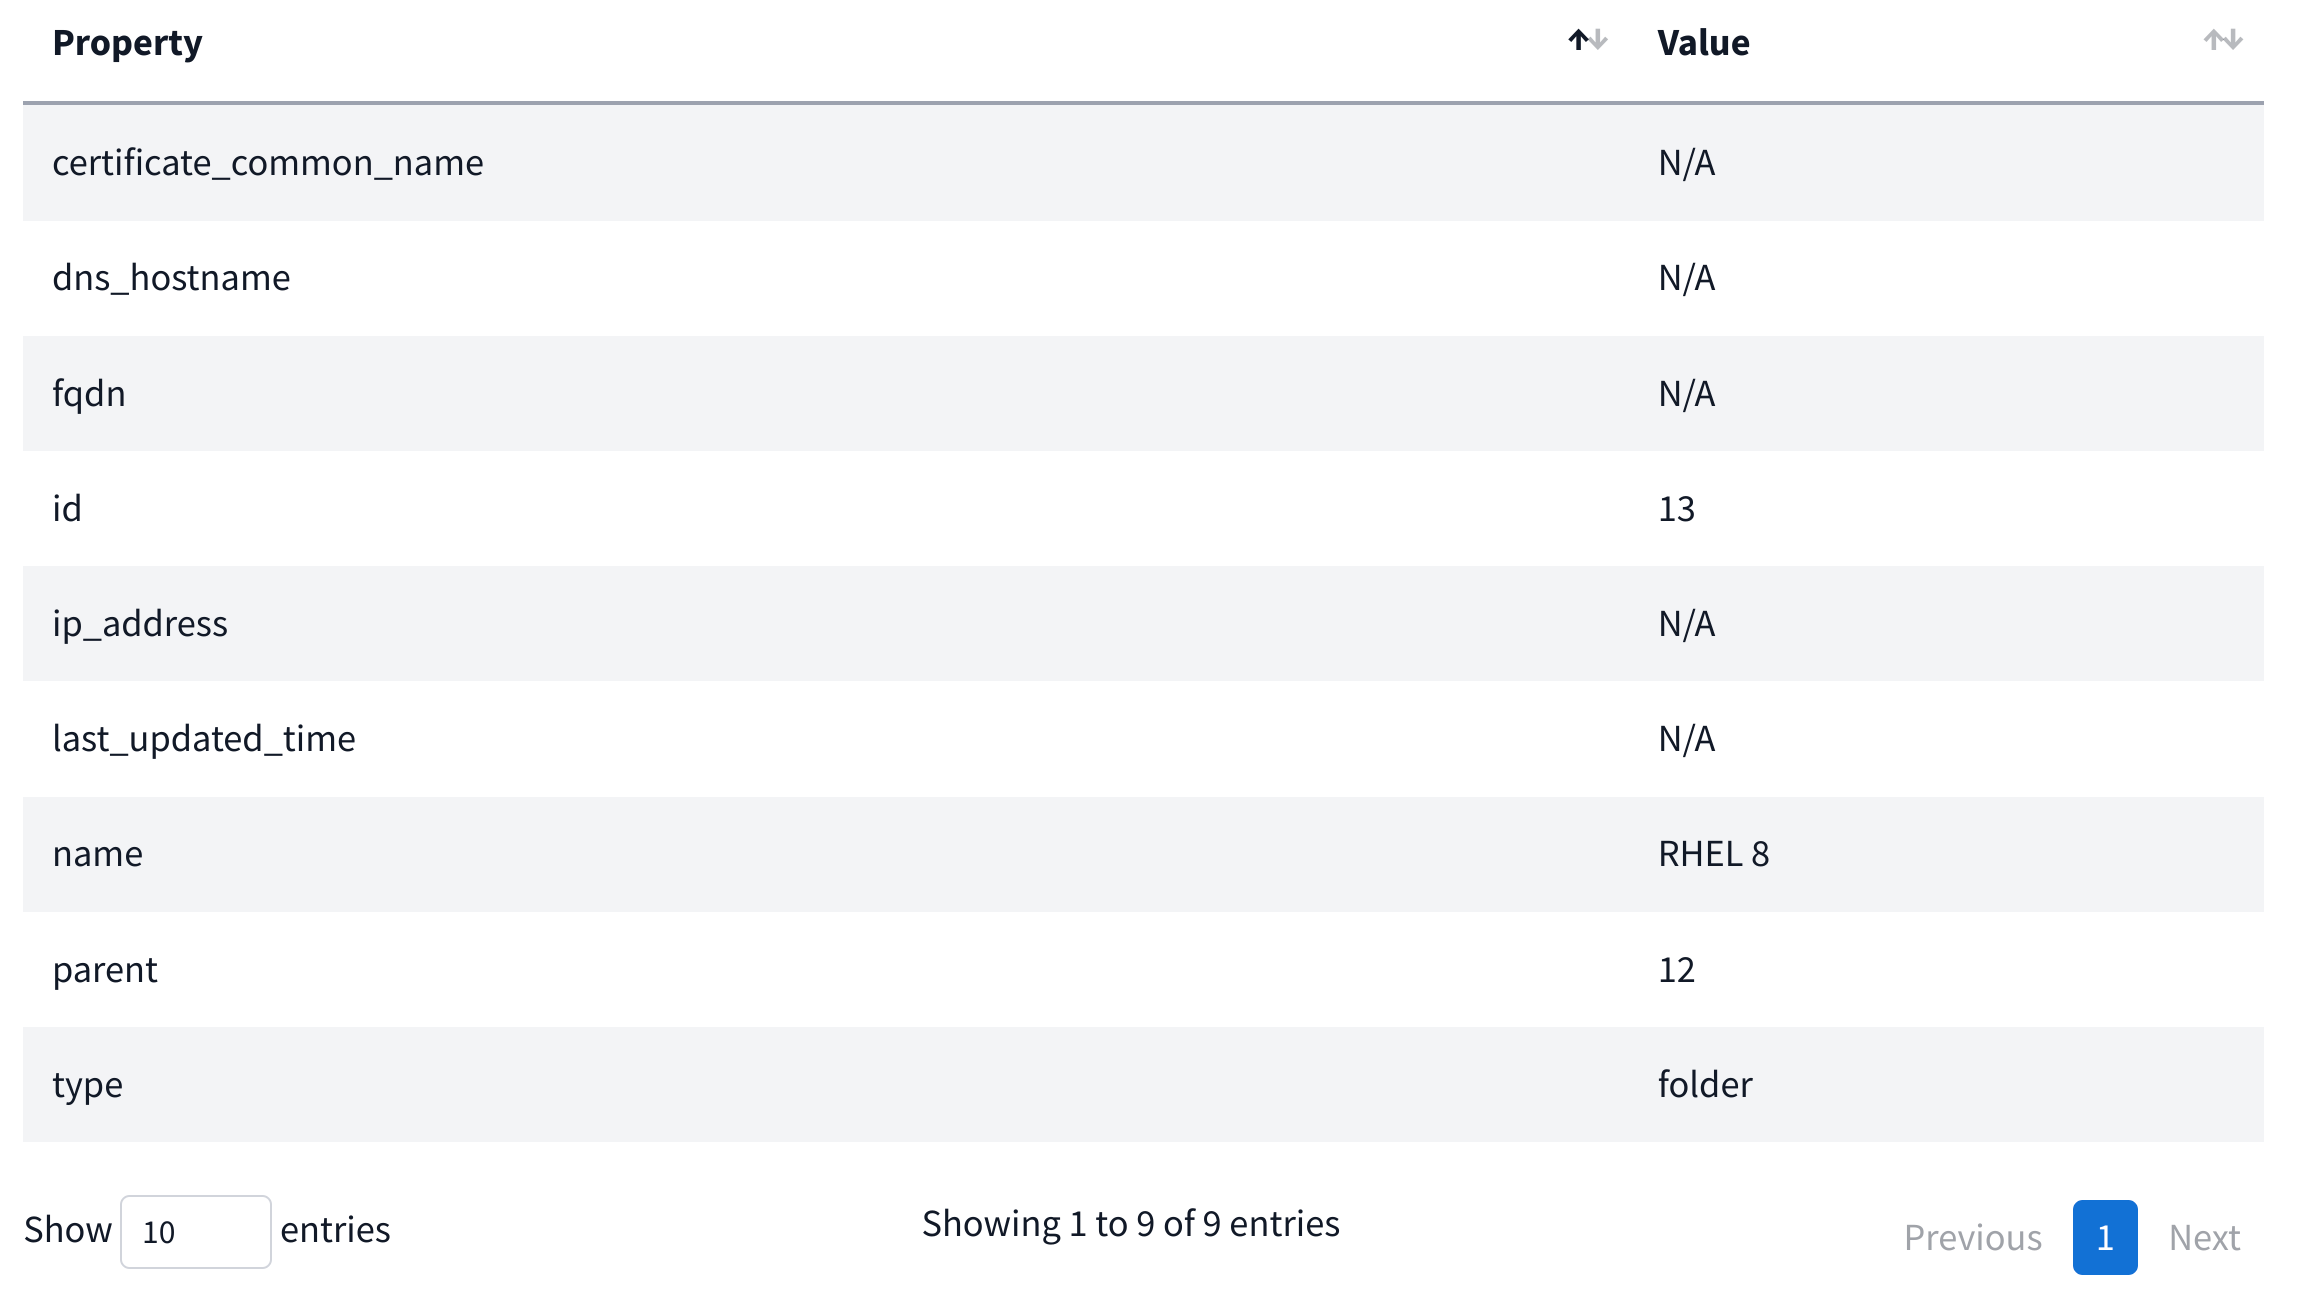
Properties displays metadata for the specific node selected. Depending on its type, you'll have more or less information.
Endpoint:
Folder:
Settings
Contains the settings that have been set or inherited for the node.
A user must have UPDATE permissions on the node in order to apply changes to settings
Enforcement Tolerance:
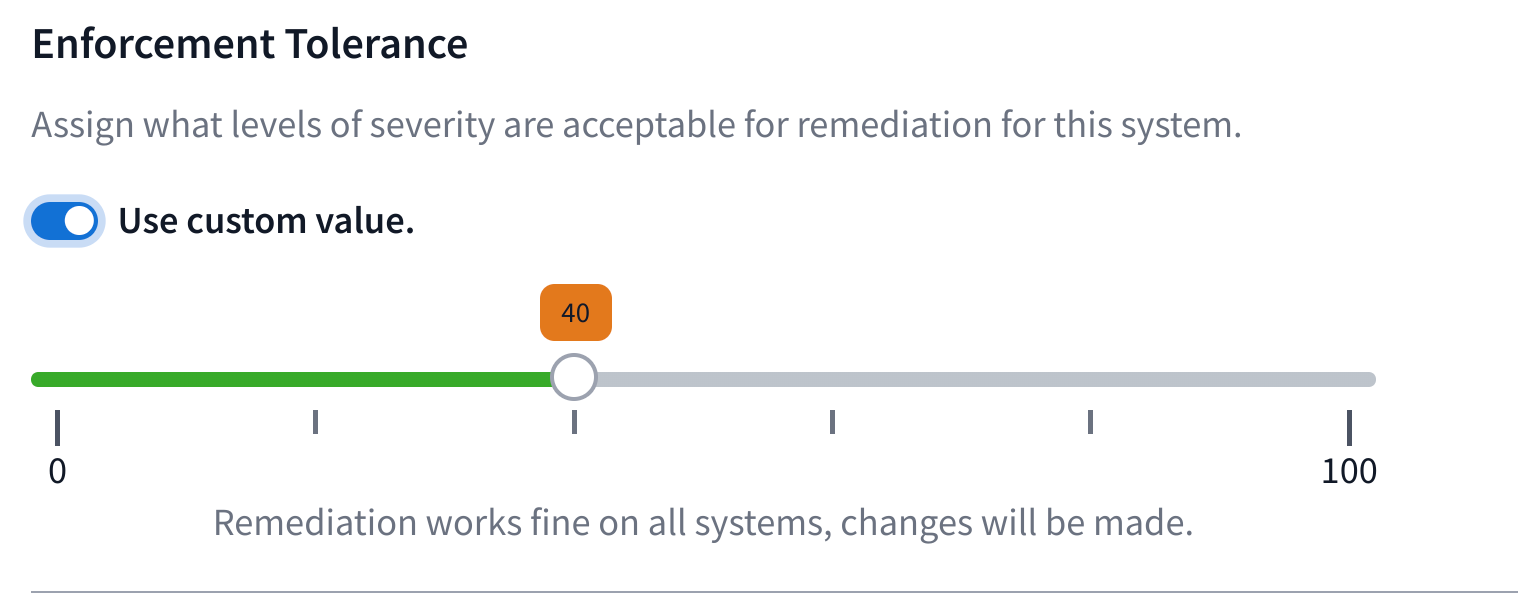
Defines what level of risk will be allowed when remediating rules from the Scan Results page. By default, level 40 is inherited from the Unassigned or All Nodes folders.
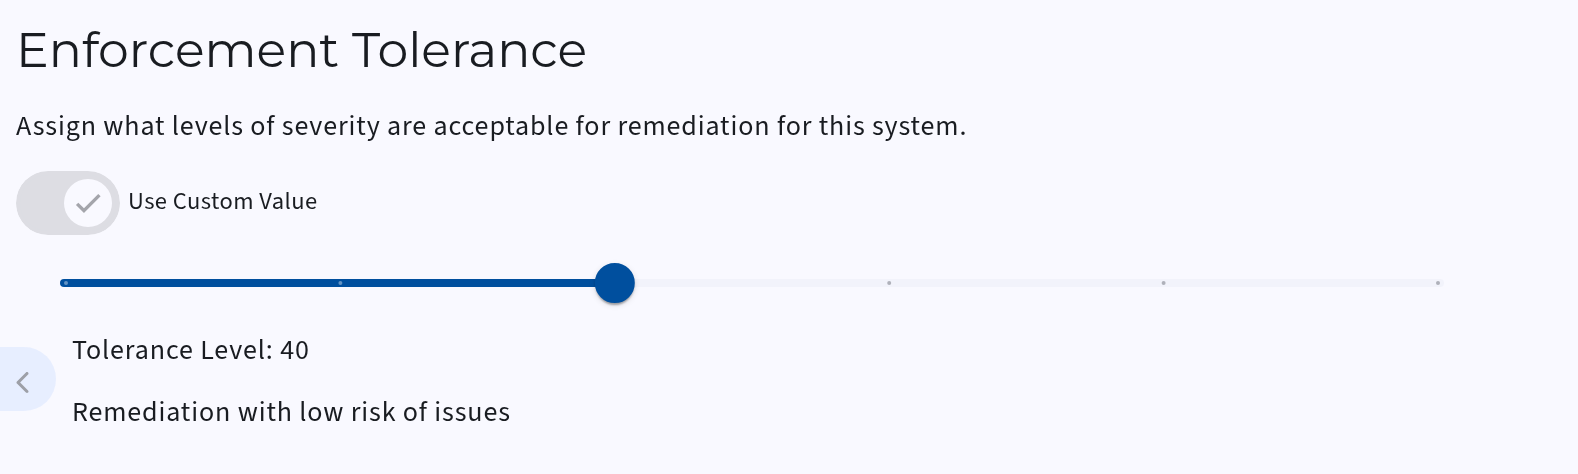
This default can be overridden by toggling the Use custom value switch. If this switch is set on a folder all nodes within the folder without the custom switch toggled will inherit the value set on the parent folder.
Risk goes up the higher the value that is set. Only use risk 100 on experimental nodes as unexpected results may occur due to remediation.
A tolerance level of 0 will disable enforcement entirely for the node.
Default Scan Profiles:
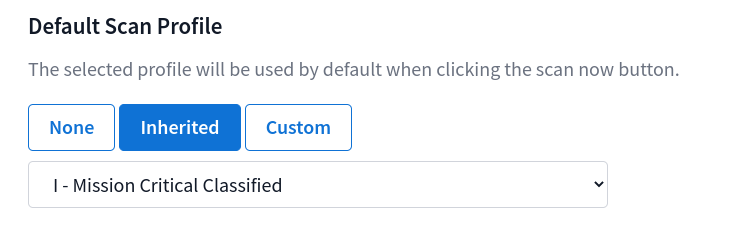
Defines which profile Scan Now should use when triggering a new scan. This setting is required for the Scan Now feature to be enabled.
Folders can set default scan profiles for children of each platform type. These defaults will apply to all top-level children that are set to inherit a profile. Folders can also inherit profiles from their parent and pass it on to their children.

Endpoints can choose to have no profile set, inherit from their parent, or define their own custom default profile. An endpoint with a custom profile set will not inherit from it's parent.
Scan Triggering
Scan triggering comes in two ways, Scan Now and Scheduled Scans. Both require a connected Sicura Agent.
Note: If running a scan on a folder type, it will scan only the direct children within that folder. Nested folders will need scans to be triggered independently.
Scan Now
For the Scan Now button to appear, a default scan profile is required to be set for an endpoint or for the system platform at the folder level. Only nodes with default scan profiles will trigger a new scan when Scan Now is clicked.
Once clicked the scan will be triggered with the configured scan profile.
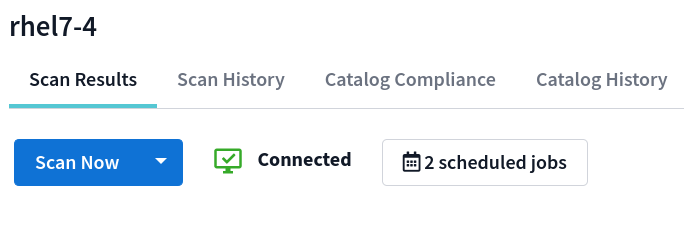
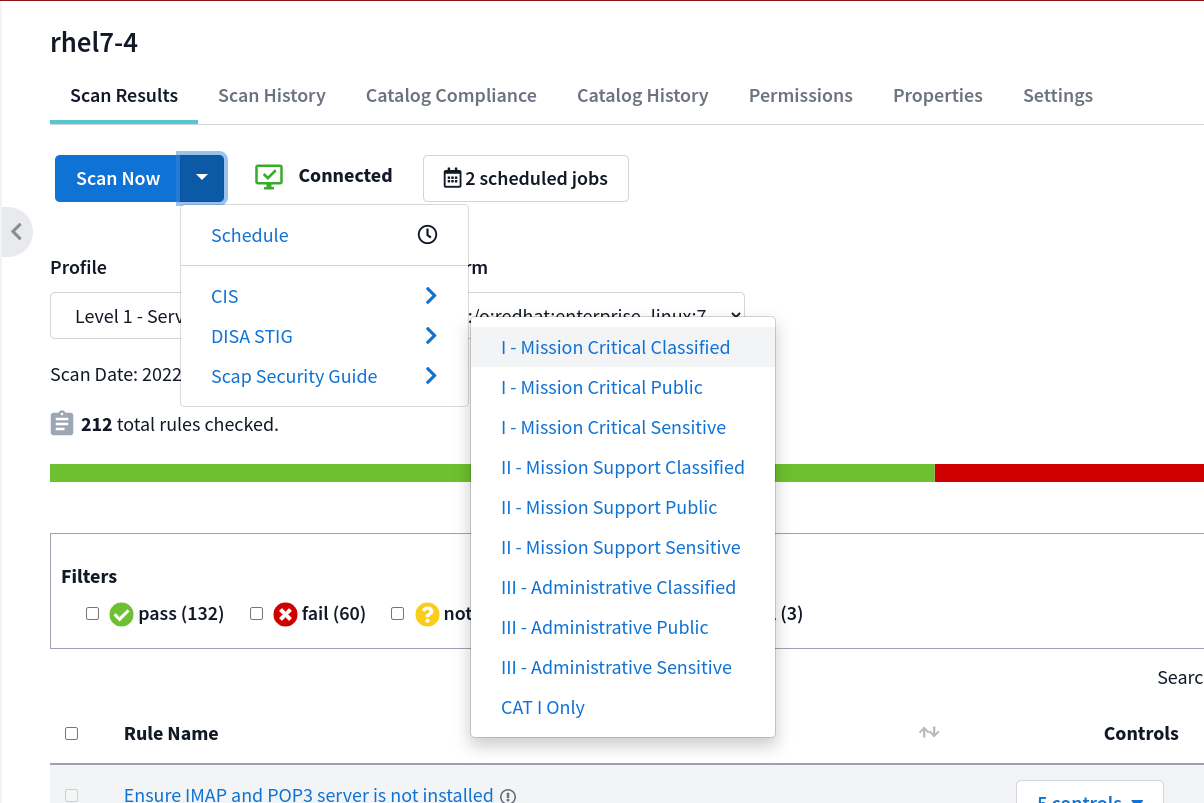
Additionally, in the dropdown next to Scan Now, you are able to explicitly trigger a scan from a list of Benchmark authors and their profiles. When you click a specific profile, the scan will be immediately triggered. In folders this will trigger a scan for all nodes that match the selected platform.
Scheduled Scan
To schedule a scan, simply click the dropdown next to the Scan Now button and select Schedule Scan. This will open the Schedule Scan drawer.
Inside the Schedule Scan drawer you can select various options that will be passed along to the Agent when it goes to perform the action.
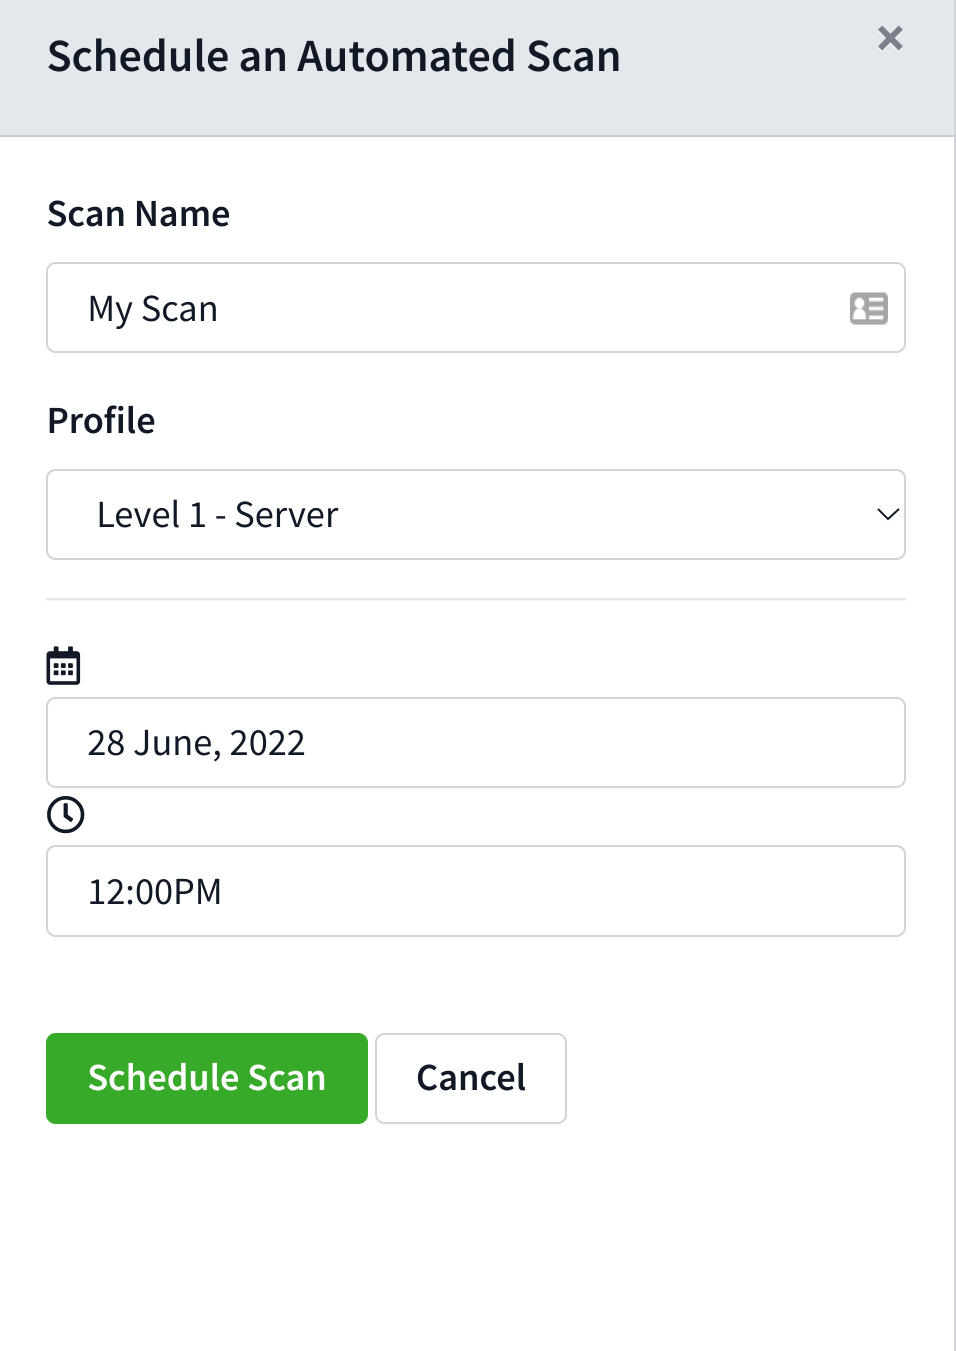
Note: The times specified are the system time of the machine running the Sicura Console. Agents are agnostic to the time of the Console and will only pick up the scan when the Console's time has reached the time configured in the scan.
Agent Connection Status
The Agent connection status is a visualization for if the node has an actively running/connected Agent that is ready to accept scans.
There are two states the Agent can be in:


Scheduled Scan Viewer
Clicking this viewer button will open the viewer pop-up screen allowing you to view previously, running, or future scheduled scans for a node.
This shows a scan that failed to complete successfully, a scan that completed successfully, a scan currently running, a scheduled catalog check posted in the future, and a scheduled scan posted in the future.
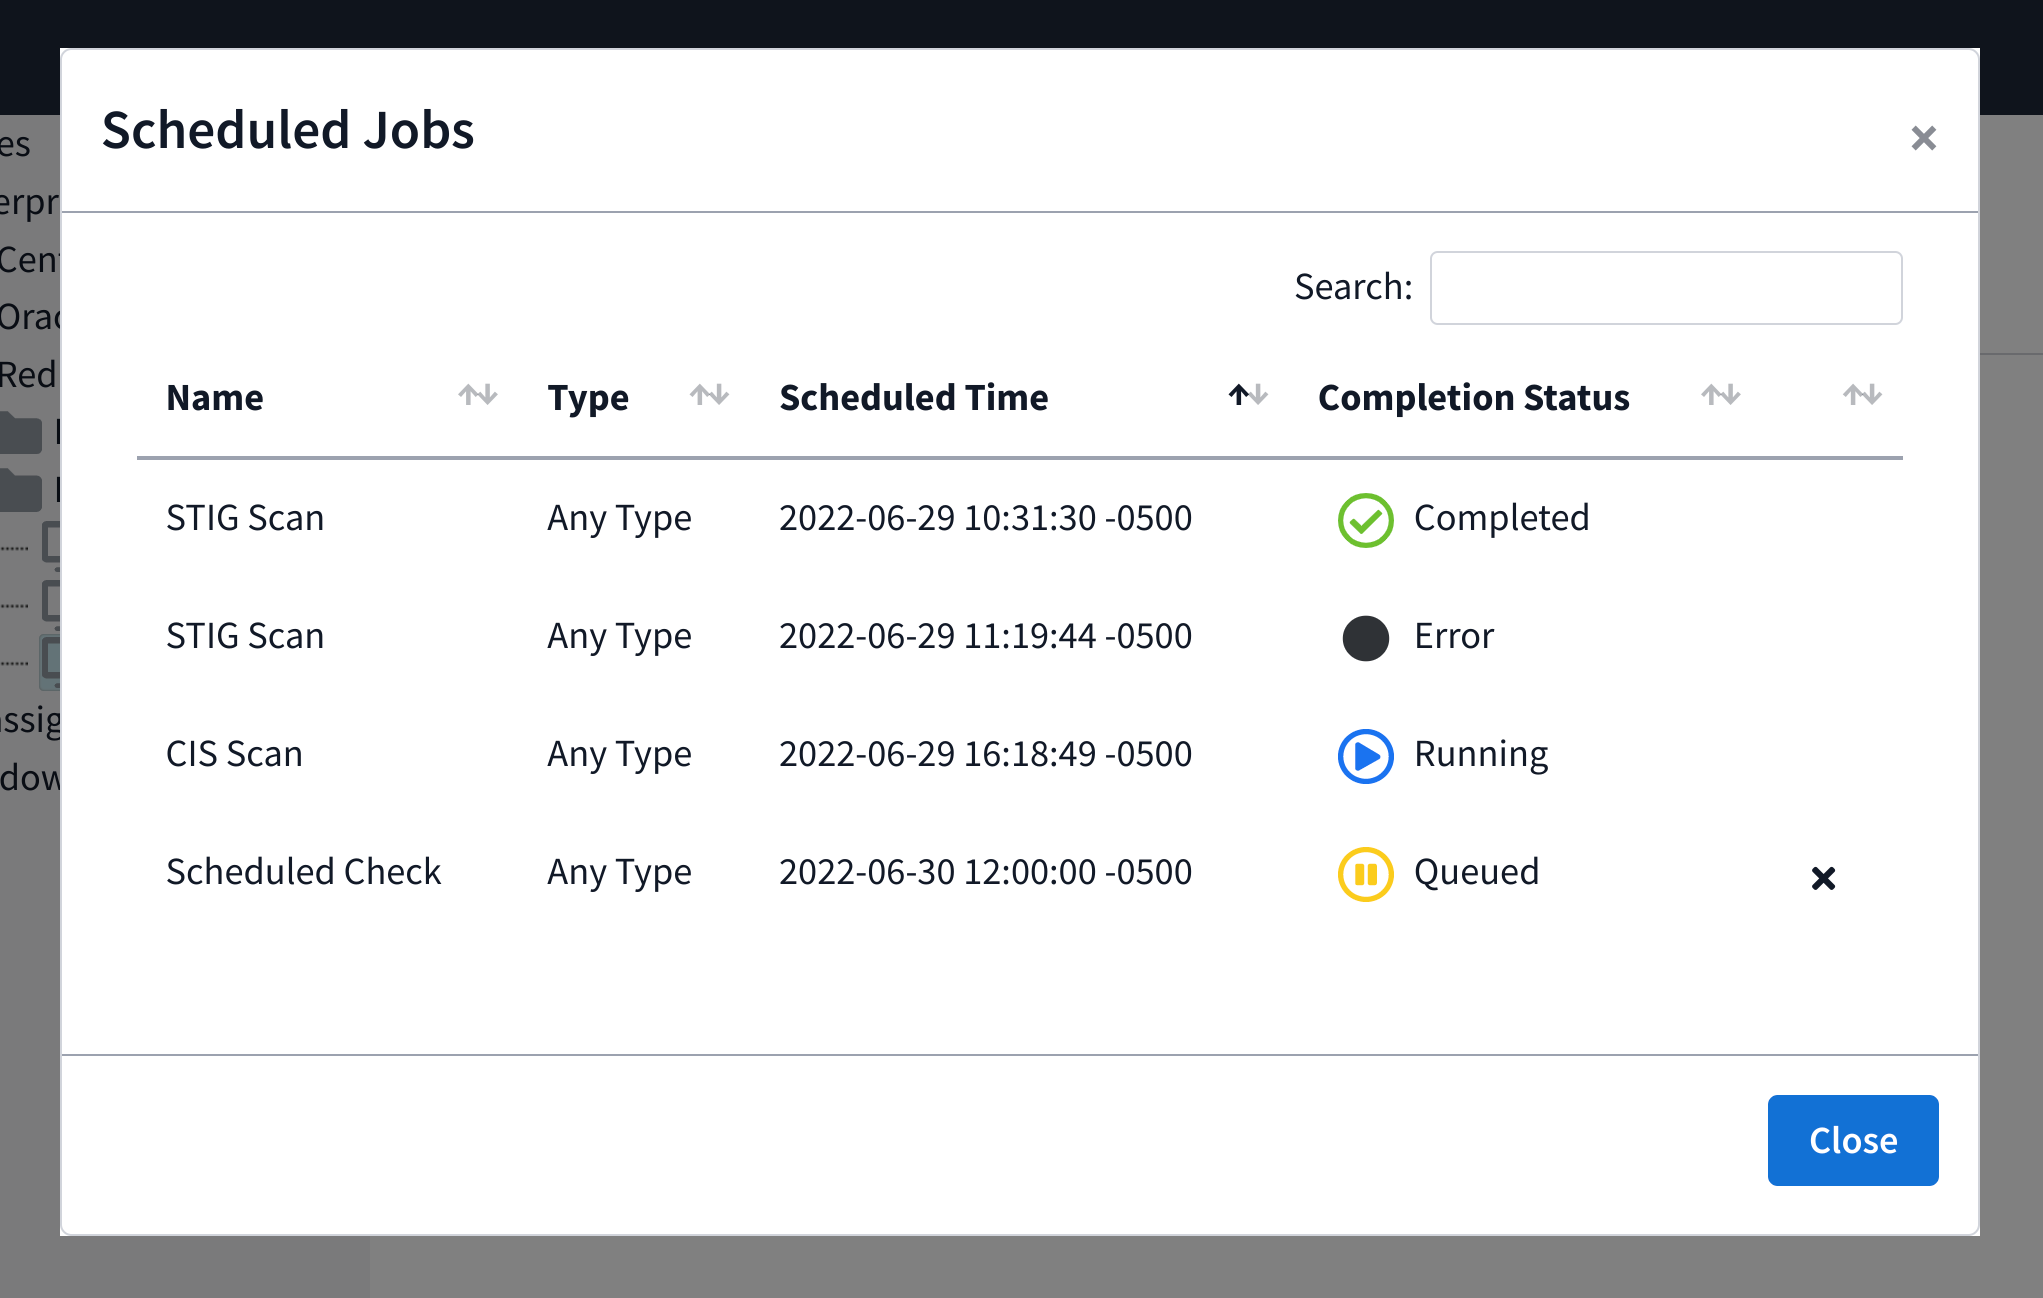
Note: Both catalog checks and compliance scans show up in the same list.